Network Traffic on iOS
If you have access to the end user's device, it can be helpful to inspect network traffic when troubleshooting a problem with the Geocortex Mobile App Framework.
Network Log
The Geocortex Mobile App Framework for iOS can optionally log all network traffic to a network log file. This feature is disabled by default for performance reasons. We do not recommend enabling network logging for normal use of the App.
This feature requires at least iOS 10, and is not available in the Android nor Windows versions. If you do not have at least iOS 10, you can still inspect remote network traffic with Fiddler.
Step 1: Enable Network Logging on the Device
-
On your iOS device, open the iOS Settings .

iOS Settings
-
Scroll down and tap Geocortex.
-
Under Geocortex Log Settings, tap the slider beside Network Logging.
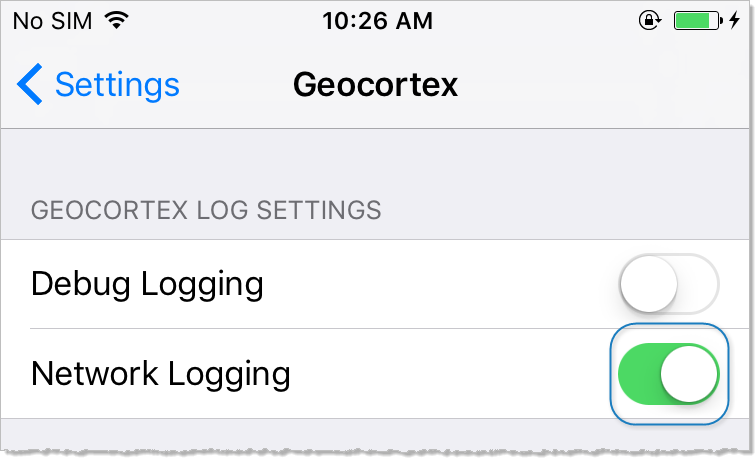
The slider becomes green, indicating network logging is enabled. When you use the Geocortex Mobile App Framework, a network log file keeps track of all network requests.
As this feature requires at least iOS 10, this setting has no effect in older versions of iOS.
Step 2: Access the Network Log File
-
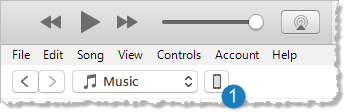
Connect your iOS device to a computer and open iTunes.
-
When your device appears in the toolbar, click the device
 .
.
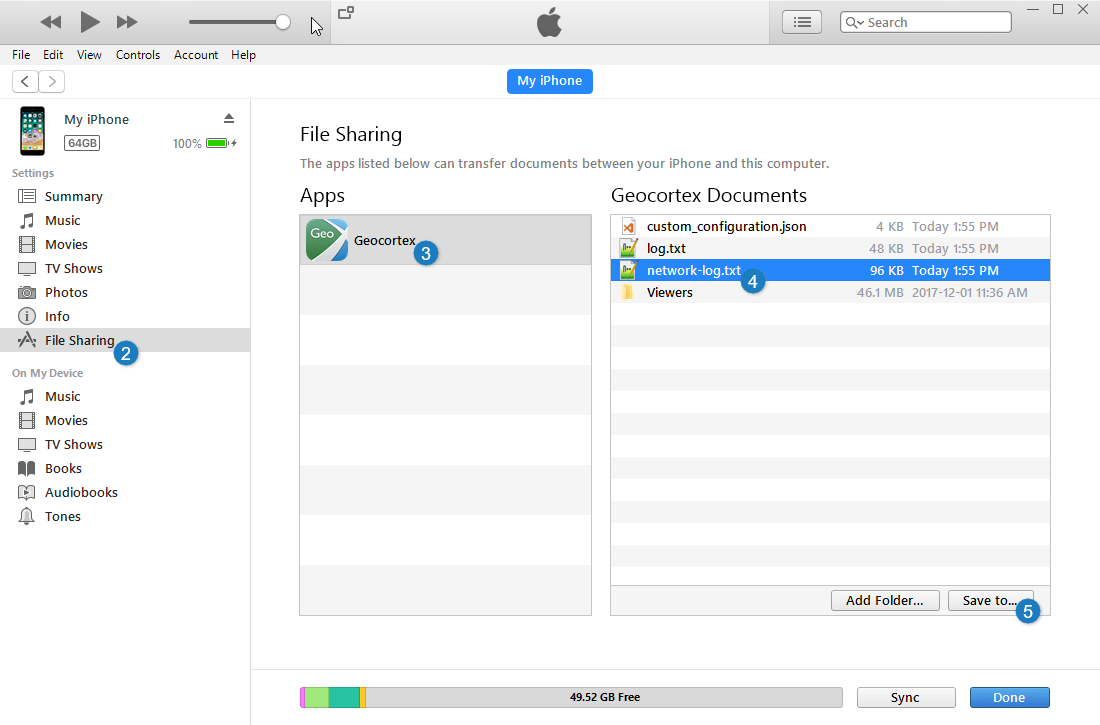
A sidebar appears to configure settings.
-
In the sidebar, click File Sharing
 .
.A new page appears to configure file sharing.
-
At the bottom of the page, the File Sharing section lists Apps from which you can save files. In the Apps list, click Geocortex
 .
.The Geocortex Documents list appears.
-
In the Geocortex Documents list, click network-log.txt
 .
. -
Click Save to
 .
. -
Navigate to a folder on your computer where you want to save the network log file, and click Select Folder.
The network log file is saved to the folder you selected.
The Geocortex Mobile App Framework also keeps two archived network log files in the same location. When a log file exceeds 10 MB, older log entries are moved in the following order: network-log.txt, network-log.0.txt, network-log.1.txt, and finally removed.
Inspect Remote Network Traffic with Fiddler
Fiddler cannot inspect network traffic that is local to thelocalhost or 127.0.0.1.
To inspect remote network traffic using Fiddler:
Step 1: Set up Fiddler on a Computer
-
On a computer that is on the same network as your
-
Start Fiddler.
-
In the Fiddler menu, click Tools, and then click Telerik Fiddler Options.
The Telerik Fiddler options window appears.
-
Click the Connections tab.
The Connections page appears.
-
Select the Allow remote computers to connect checkbox.
-
Note the Fiddler listens on port number, as you will need this port number later.
-
Click OK.
-
Click OK.
-
Restart Fiddler.
If prompted by the firewall, allow remote access for Fiddler. Otherwise, you may need to manually edit the firewall settings.
Step 2: Set up the Device
-
On the
iOS Settings
-
Tap Wi-Fi.
-
-
Scroll down to HTTP Proxy and tap Manual.
-
In the
To determine the name of a Windows computer, hold down the Windows key and press the Pause/Break key.
-
In the
-
Make sure the Authentication setting is disabled.
Step 3: Inspect Traffic
-
On the computer, run Fiddler.
If you are prompted by the computer's firewall, allow remote access for Fiddler.
-
On the
-
Use the Geocortex Mobile App Framework.
Fiddler displays the remote network traffic.
-
To display more information about a particular network activity in Fiddler, click the activity and then click the Inspectors tab.