Heat Maps
The Essentials Heat Maps feature is only available for ArcGIS Server feature layers.
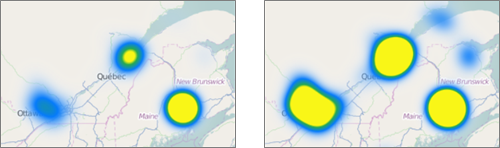
Large amounts of point data on a map tend to overlap and can be difficult to interpret. Heat maps resolve this issue by representing data densities instead of individual features.
In heat maps, different colors are used to represent different density ranges—the highest density, medium density, and lowest density. The colors are configurable. In the screen capture below, the heat map uses yellow to represent the highest density of features, red to represent medium density, and blue to represent the lowest (non-zero) density.
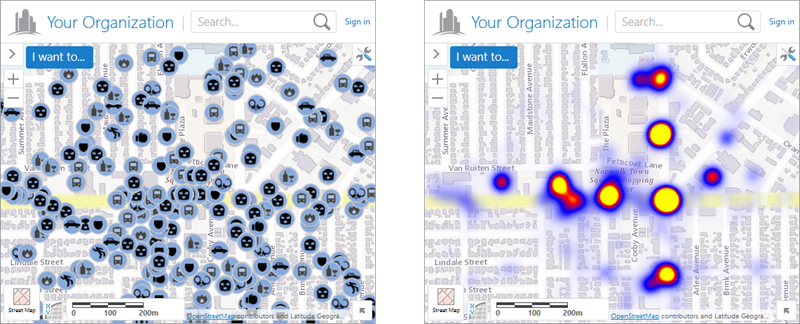
Crime data shown individually (left) and in a heat map (right)
You can configure the default visibility of heat maps, and you can enable end users to turn heat maps on and off. You can also configure settings that control the appearance of hot areas on the map, such as the colors and intensity.
If you do not configure the appearance settings in Manager, viewers use the default settings that are defined in the viewer's HeatMaps Module.
Heat maps work for point layers only. You cannot display heat maps for line or polygon layers.
The colors that are used for a layer's heat maps show in the map legend and in legend swatches in the Layer List.
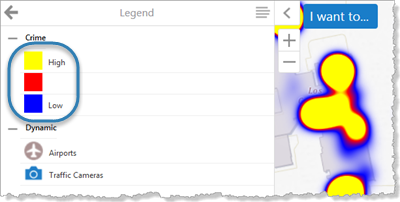
Heat map colors in the map legend
Heat maps offer one method of visualizing data. Clustering is another method.
Heat Map Settings
Heat maps have the following settings:
-
Enabled: Specifies whether heat mapping is initially turned on or off. If you want features to be presented as a heat map when end users first view the layer, select the checkbox. By default, the checkbox is initially cleared.
If you enable heat maps, you should disable clustering for this layer. Clustering and heat maps cannot both be displayed at the same time.
-
User Can Enable/Disable: Specifies whether users can turn heat mapping on and off. Enabling this setting also allows users to change the intensity and intensity multiplier. By default, users can turn heat mapping on and off. If you do not want users to be able to turn heat mapping on and off, clear the checkbox.
If you do not want users to be able to turn heat mapping off, you must clear the User Can Enable/Disable checkboxes for both clustering and heat maps. When a user turns on clustering, heat mapping turns off, regardless of whether users can enable and disable heat maps. The screen capture below shows the configuration to use if you do not want users to be able to turn heat mapping off by any means.
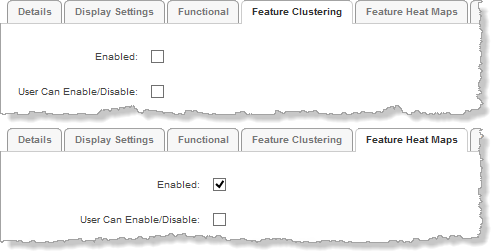
Settings to use if you want heat mapping always turned on
-
Respect Layer Scale Range: If you want heat maps to show only when the layer is visible on the map, select the checkbox. If you want heat maps to show when the map is zoomed in or zoomed out beyond the layer's scale range, clear the checkbox. By default, the checkbox is cleared.
This setting uses the scale range that is defined in the Esri layer, not the scale range defined by the Override Minimum Scale and Override Maximum Scale settings on the layer's Display Settings tab in Manager.
-
Intensity: Controls the area that hot areas cover, in pixels. The greater the intensity, the larger the area of coverage. Enter a number from 1 to 100. The default is 30 pixels.
Use a lower intensity for feature layers with a high concentration of data and higher intensity for feature layers with sparse data.
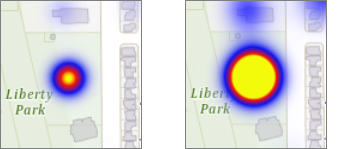
Lower intensity (left) and increased intensity (right)
-
Field: A numeric field in the feature layer to use to multiply the intensity. For example, you might want to multiply the intensity in an earthquakes layer by the magnitudes of the earthquakes. This increases the intensity of the hot areas proportionately, based on the magnitude.
Earthquakes heat map with no multiplier (left) and multiplied by the magnitude (right)
By default, the Field setting is blank, which means that the intensity is not multiplied. If you want to multiply the intensity, select the name of the field to multiply the intensity by.
-
Gradient Options: Controls the colors that represent the hot areas on this layer. You can also configure the opacity for each color. The viewer creates gradients using the colors that you configure.
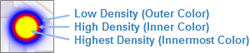
The default gradient: Transparent, blue, red, yellow
-
Color: For each color that you want to use to represent hot areas on the map, use the color picker
 to select a color, enter the color's HTML name (for example, red), or enter a hex value (for example, #FF0000). The color picker displays a preview of the color and opacity that you have selected. If the color picker for a setting does not show, drag the Color Alpha slider to the right.
 The Lowest Density (Outermost Color) is completely transparent by default, to ensure that the outer color changes gradually. We recommend using the default value for the outermost color.
-
Color Alpha: Controls the opacity of each color in the gradient. Drag the slider to the left to decrease the opacity.
-
Configure Heat Maps
To configure heat maps on a layer:
-
In
Make sure you edit the feature layer's map service component, not the layer component.
-
Click the Feature Heat Maps tab.
-
Configure the settings.
-
Click Apply Settings.
Remove Heat Maps from a Layer
When you remove heat maps from a layer, end users cannot turn heat maps back on.
To remove heat maps from a layer:
-
In
Make sure you edit the feature layer's map service component, not the layer component.
-
Click the Feature Heat Maps tab.
-
Clear the Enabled checkbox.
-
Clear the User Can Enable/Disable checkbox.
-
Click Apply Settings.