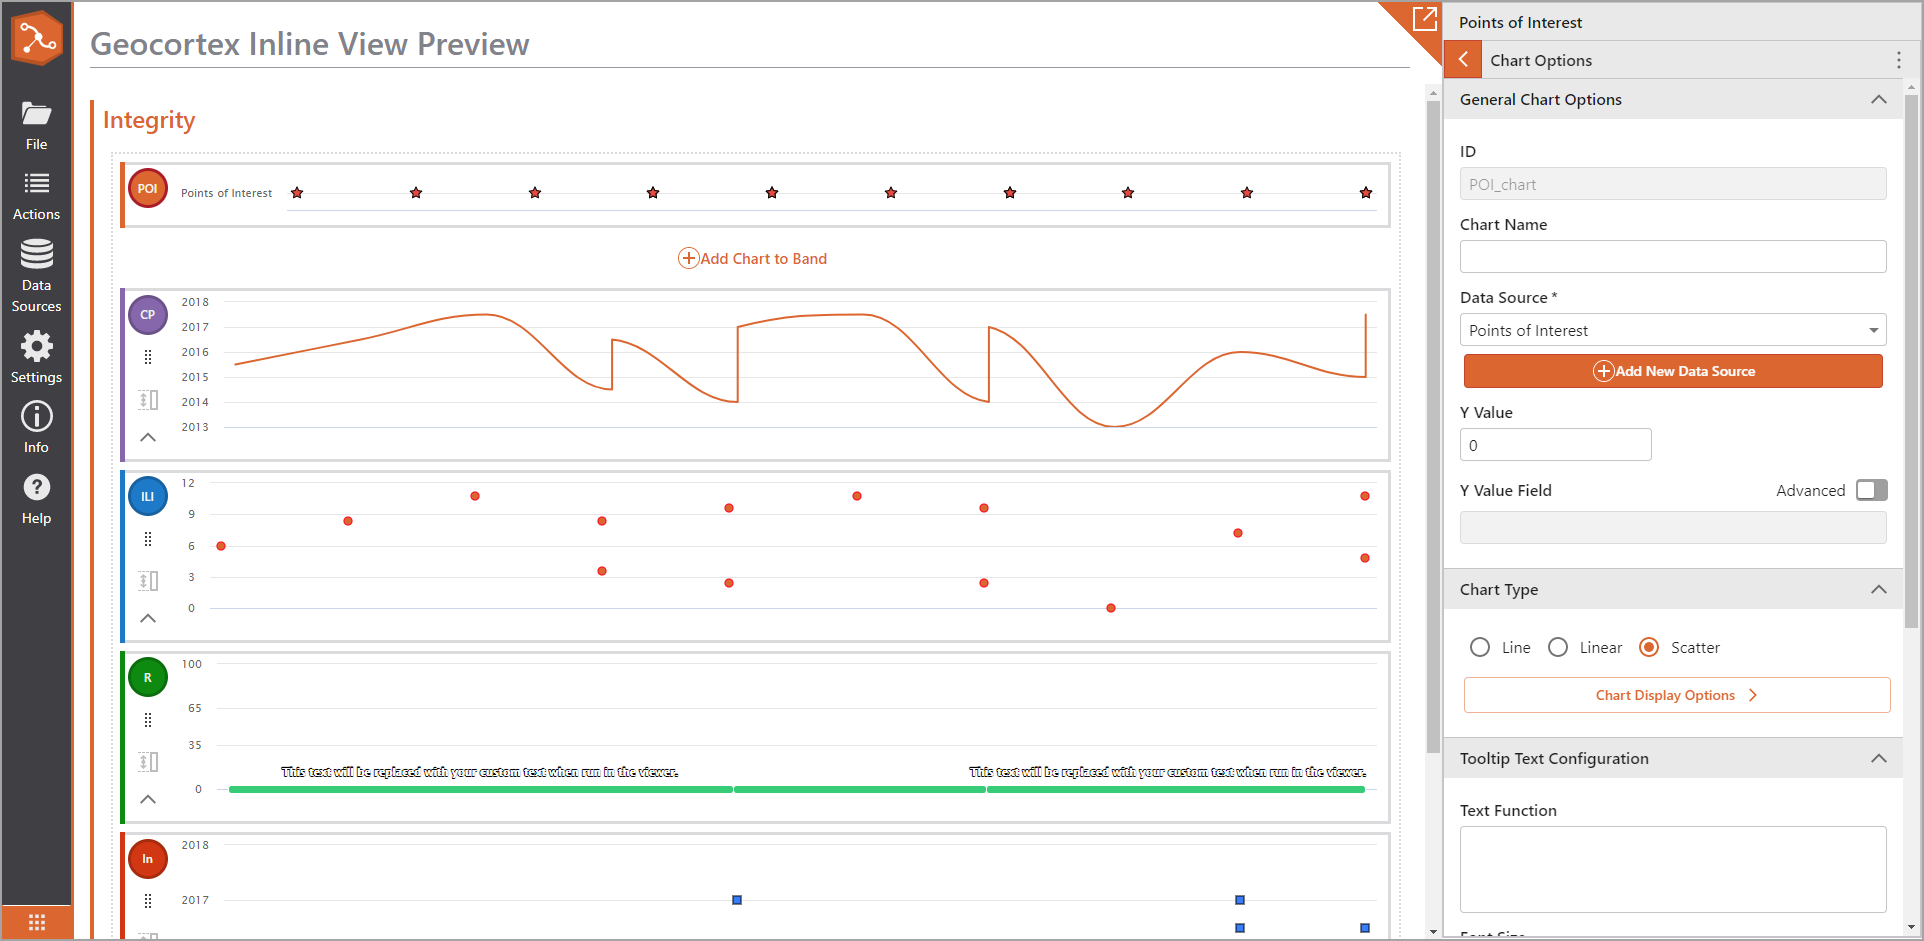
The VertiGIS Inline Designer provides an easy-to-use, intuitive interface that lets you create the following types of charts from your linear referenced data sources:
•Line chart
•Linear chart
•Scatter chart
Charts are added to bands, allowing you to group related charts in the same band.
Once you have added a chart, you can customize it by adjusting its display options, adding labels, creating tooltips, and configuring custom actions that your users can trigger—for example, you may want to allow users to print a report from a chart.
Advanced options include the ability to add custom functions. You can use these for many purposes, for example, you can create functions that filter the data displayed in a chart, fine-tune display options, or set the band/chart name using a variable.