Welcome to the VertiGIS Studio Inline Designer Help. The Designer Help explains how to use the web-based designer, which is a component of VertiGIS Studio Inline.
VertiGIS Studio Inline is a powerful solution that enables the dynamic visualization and exploration of linear referenced data alongside a map within a viewer. This data is presented via configured charts linked to a linear feature's relative position. Configured Views provide the ability to create "views" of the data by selecting relevant data layers, grouping the data in bands, then symbolizing and attributing the presented data.
Inline enhances productivity and allows organizations to tap into powerful decision-making, processing, and integration tools to enhance their investment in linear referenced data.
VertiGIS Studio Inline Designer is an HTML5 and JavaScript web application that runs in a browser. The graphical interface lets you create interactive straight-line diagrams and alignment sheets, allowing you to present your linear referenced data to your users in a dynamic interface called a view.
Users access views by logging into the web map application Inline has been deployed to - Geocortex Viewer for HTML5, VertiGIS Studio Web, or ArcGIS Web AppBuilder. They can then interact with the data using the charts and actions you have configured in the Designer.
The VertiGIS Studio Inline application includes the following:
▪VertiGIS Studio Inline: an HTML and JavaScript library and user interface that is downloaded to the user’s browser when they open an Inline view.
▪VertiGIS Studio Inline view definition file: a JSON configuration file that contains the web map configuration, and the band and chart configuration for the Inline views.
▪Web map configuration: a JSON configuration file (included in the view definition file), that references the data sources for Inline and its map component.
▪Web map application: an HTML and JavaScript web application used for visualizing and interacting with Inline and its map component. For details on supported applications, see Requirements.
▪VertiGIS Studio Inline Designer: an HTML and JavaScript web interface used to create a custom view definition file.
For details on architecture and setup, see Setup.
VertiGIS Studio Inline Designer Interface
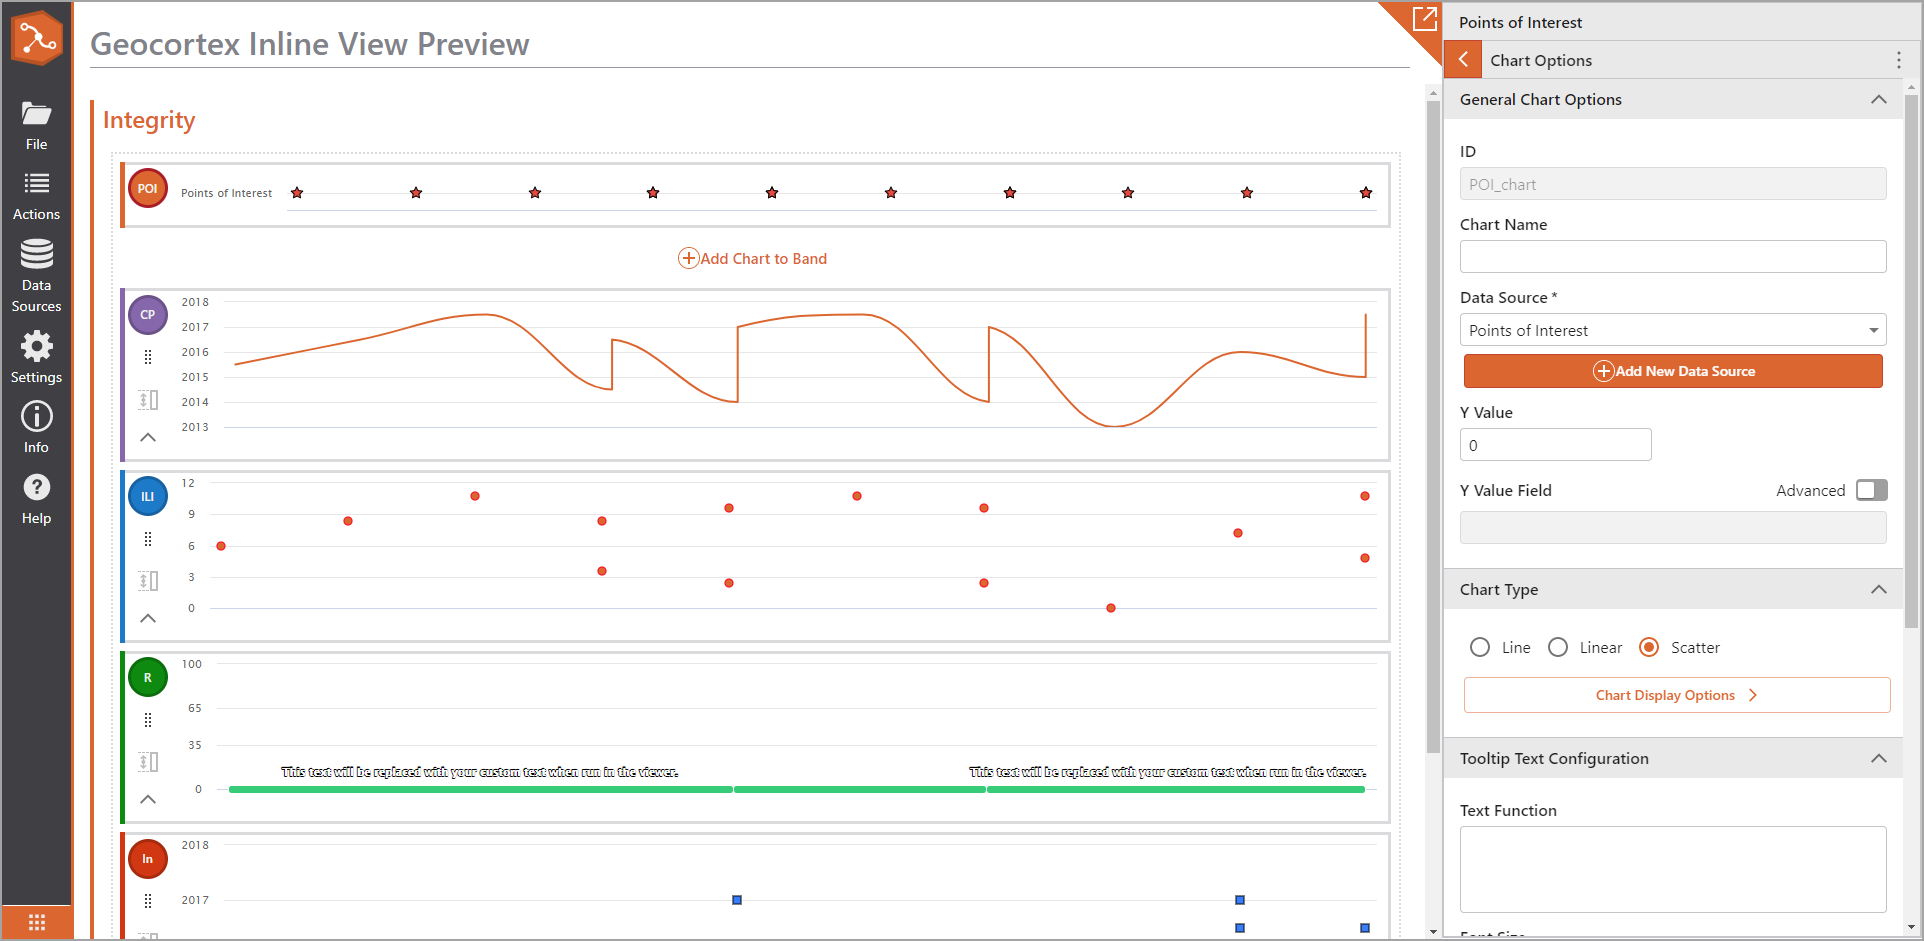
The VertiGIS Studio Inline Designer provides an easy-to-use, intuitive interface that lets you create the following types of charts from your linear referenced data sources:
▪Line chart
▪Linear chart
▪Scatter chart
Charts are added to bands, allowing you to group related charts in the same band.
Once you have added a chart, you can customize it by adjusting its display options, adding labels, creating tooltips, and configuring custom actions that your users can trigger—for example, you may want to allow users to print a report from a chart.
Advanced options include the ability to add custom functions. You can use these for many purposes, for example, you can create functions that filter the data displayed in a chart, fine-tune display options, or set the band/chart name using a variable.
Integration with Esri Portal
VertiGIS Studio Inline works closely with Esri ArcGIS Online and Portal for ArcGIS. Use your preferred portal to create web maps, and then use those maps as data sources to create your views in the Designer.
Sign in to the Designer using your ArcGIS Administrator identity. If you do not have an on-premise portal, you can sign in with your ArcGIS Online account.
