Welcome to the VertiGIS Studio Inline User Help. The User Help explains how to use the VertiGIS Studio Inline features.
VertiGIS Studio Inline is a powerful solution that enables the dynamic visualization and exploration of linear referenced data alongside a map within a viewer. This data is presented via configured charts linked to a linear feature's relative position. Configured Views provide the ability to create "views" of the data by selecting relevant data layers, grouping the data in bands, then symbolizing and attributing the presented data.
Inline enhances productivity and allows organizations to tap into powerful decision-making, processing, and integration tools to enhance their investment in linear referenced data.
Key Concepts
Actions
Actions are events that you can trigger from a band, chart or feature. All actions are triggered from the context menu of the band, chart or feature. Actions triggered from a feature are known as feature actions.
Bands
Bands are containers that group together related charts.
Charts
VertiGIS Studio Inline supports the following chart types:
▪Line charts
▪Linear charts
▪Scatter charts
▪Area charts
▪Area range charts
Line charts
Line charts display data as a series of points connected by lines. The data points may be connected with straight or curved lines.

Linear Charts
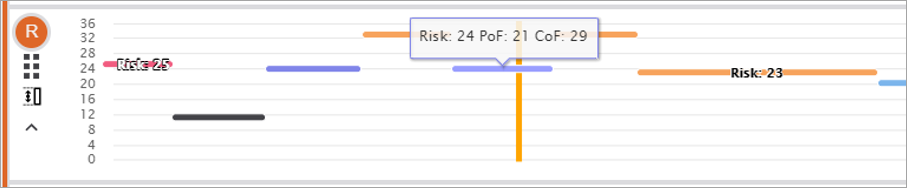
Linear charts always display information as a straight line. They are used to display linear features for which the rate of change for y values in relation to x values is constant.

Or, linear features that have values that can be used to sort features on the y axis.
Scatter Charts
Scatter charts use points to represent values for two different variables, and show the relationship between those variables. Traditionally, each individual data point is represented by a dot on the chart, but a symbol may also be used.

Area Charts
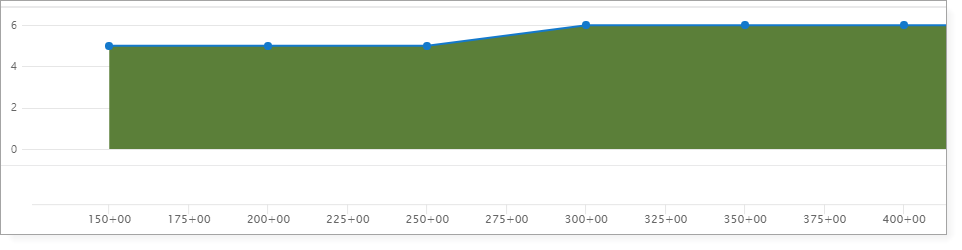
Area charts require a single Y value and create a filled polygon between 0 and the Y value. Negative Y values are supported but the chart will always be plotted from 0 to the Y value.
Area Range Charts
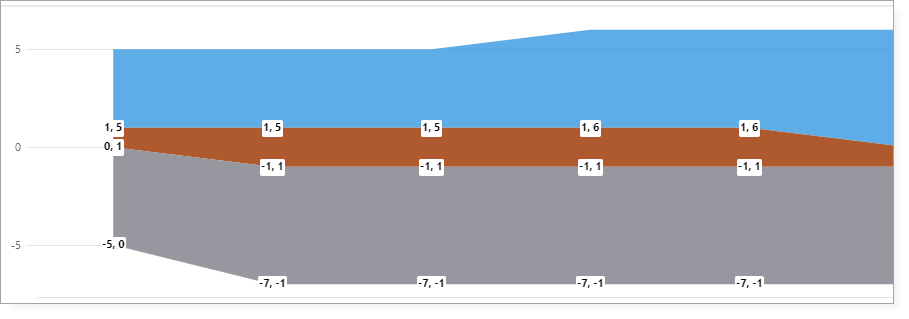
Area range charts require two Y values and create a filled polygon between the Y1 and Y2 values. Negative values are supported and can span the 0 point of the chart. Multiple area range charts can be added to a band to create a cross profile view of the data.
Points of Interest
The Points of Interest band allows you to add points of interest to the charts in VertiGIS Studio Inline. This band may not appear if your administrator has removed it.

