Get Started
When a user runs a report, VertiGIS Studio Reporting gets the data from the data source and then populates the report with the data according to the author's design.
There are several steps to use a data source in a report. First, you must configure the data source's connection information. VertiGIS Studio Reporting uses the connection information to connect to the data source when the user runs the report. Next, add the data source to the report. This makes the data source available to the report. Finally, add data fields to the report's layout. This includes the data in the generated report. These are the minimal steps to include data in a report. In a production report, you will also want to format the report's content, add headers and footers, and so on.
In the tutorial below, you will use a public ArcGIS Online map service as the data source. To help you get started designing and running reports quickly, the tutorial uses the Layer Report template to create the report. The Layer Report template creates a layer report—a report that presents ArcGIS feature data for the features that are currently selected by the user.
The Layer Report template simplifies report creation by performing some of the steps for you. The template creates the data source, adds the data source to the report, configures the report to restrict the data to the user's currently selected features, and adds content (controls) to the layout. A control is a single visual element that presents a particular type of content, such as an image, text, or a data field. Sometimes, you may want to do these steps yourself, instead of using a template. Tutorial - Create a Layer Report Using the Blank Report Template shows how to do each step in detail.
Tutorial - Create a Simple Report Using the Layer Report Template
In this tutorial, you will create and preview a report that presents fields from an ArcGIS layer of US states. The report will present five fields for each state:
-
OBJECTID: The feature ID -
STATE_NAME: The name of the state -
STATE_FIPS: The Federal Information Processing Standards (FIPS ) code -
SUB_REGION: The region within the US where the state is located -
SQMI: The area of the state in square miles
When you preview the report, the Preview function will prompt you to enter the feature IDs of one or more states. These are the states that will be included in the report. In a production environment, the end user is not prompted to enter feature IDs. Instead, the report uses the current selection set. This reflects the typical pattern of how reports are used in a web mapping environment: the user selects some features on the map or in search results and then runs the report on those features.
Before you Begin
can run in two environments—in the cloud or on premises. To do this tutorial, you must have an ArcGIS identity that gives you access to one of these environments.
-
Cloud: To do this tutorial in the cloud environment, you need an ArcGIS Online account. You can use a public account or an organizational account. You can get a public account here for free.
-
On Premises: To do this tutorial using on-premises , must be installed and registered either with Portal for ArcGIS or with ArcGIS Online. See for instructions. The registration information is on the Post Installer's panel.
-
Portal for ArcGIS: If is registered with your organization's on-premises installation of Portal for ArcGIS, do this tutorial using the account that you use to access your organization's portal.
-
ArcGIS Online: If is registered with ArcGIS Online, do this tutorial using your ArcGIS Online account.
-
Steps to Create a Simple Report Using the Layer Report Template
The steps to create and run a simple report using the Layer Report template are as follows:
- Create a new report using the Layer Report template.
- Add and remove data fields.
- Configure the report's title.
- Preview the report.
- Save the report.
Step 1: Create a new report using the Layer Report template
In this step, you will follow the instructions in the Layer Report wizard to create the data source and specify which layer the report's data will come from.
-
Launch VertiGIS Studio Report Designer and click Let's get started. Sign in if you are prompted.
If you are using VertiGIS Studio Reporting in the cloud, you can access Report Designer here.
-
Click Layer Report.
If Report Designer was already open when you started the tutorial, click File | New | Layer Report.
-
Select Use a new ArcGIS layer or table, and then click Next.
This option configures a new data source.
-
Type the following name for the data source:
Census Map Server -
Enter the following URL for the data source:
https://sampleserver6.arcgisonline.com/arcgis/rest/services/Census/MapServer 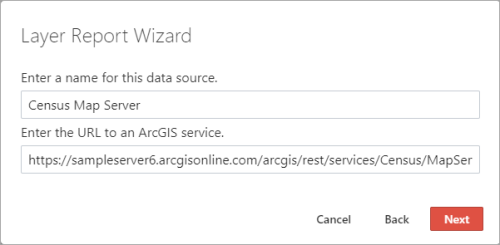
-
Click Next.
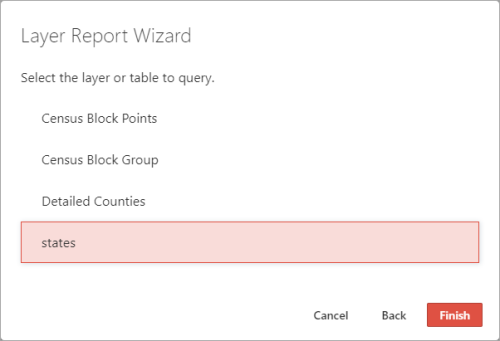
The Layer Report template connects to the map service and displays its layers.
-
Select the states layer.
-
Click Finish.
The new layer report opens.
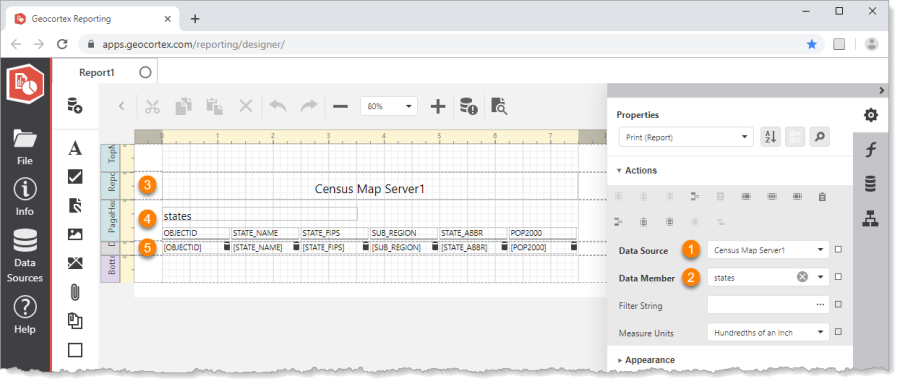

The report uses the data source that you created.

The report gets its data from the layer (data member) that you selected in the wizard.

The Report Header is a horizontal band that will appear once at the beginning of the generated report.
By default, the Report Header contains the name of the data source.
The Page Header band will appear on every page of the generated report.
By default, the Page Header contains the layer name, as well as a table whose contents act as column headings for the report's data.
The Detail band is the report's data area. By default, the Detail band contains a table of the first few (printable) fields from the selected layer. Field names are surrounded by square brackets, for example, [OBJECTID]. Controls that contain a data field have an icon
 to indicate that they get their values dynamically, in other words, when the report is generated.
In the generated report, the contents of the Detail band are repeated once for every feature. The report has a query filter (not visible in the screen capture) that restricts the features to the user's current selection set.To see the structure of the report, click Report Explorer
 . The Layer Report template creates a report with the structure shown below. The table1 control in the PageHeader1 band is the table of column headings for the data. The table2 control in the Detail1 band is for the data.
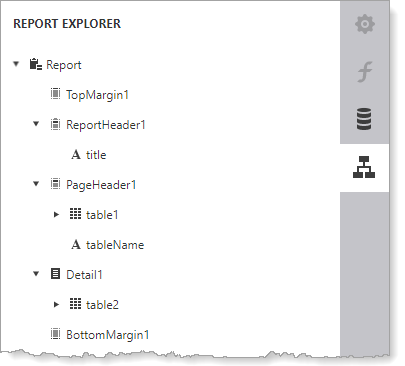
Structure of a report created by the Layer Report template
Step 2: Add and remove data fields
In this step, you will configure the data fields to include in the report. To do this, you will modify the tables in the Page Header and Detail bands.
-
Remove the STATE_ABBR and POP2000 columns from the tables:
-
Hold the Ctrl key down.
-
Click the STATE_ABBR, [STATE_ABBR], POP2000 and [POP2000] controls on the design surface to select them.
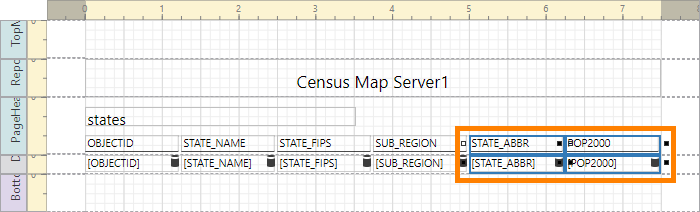
Table cells selected in two different tables
-
Press Delete.
The columns are deleted and the SUB_REGION controls expand to fill the space.
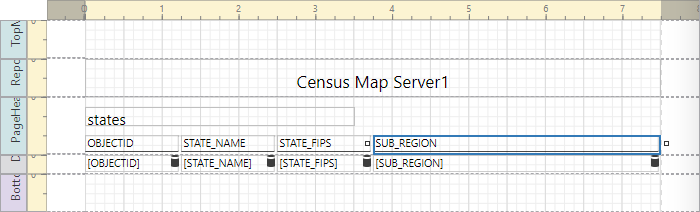
STATE_ABBR and POP2000 columns removed
-
-
Add a column for the state's area:
-
Make sure SUB_REGION is selected and click the Insert Column to the Right icon
 in the Actions section of the Properties panel.
When you add a column to a table, it has the same formatting as the column it was created from.
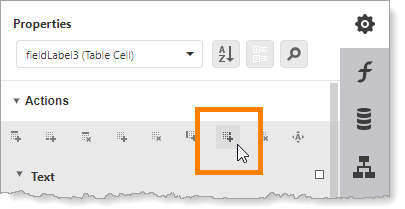
Insert a column to the right of the selected table cell
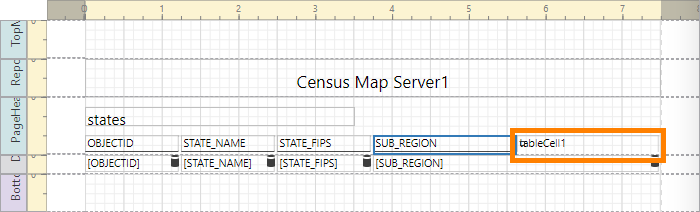
New column added to the table in the Page Header band
-
Double-click tableCell1 to make it editable.
-
Type Area (sq mi) and then click anywhere outside the table cell.
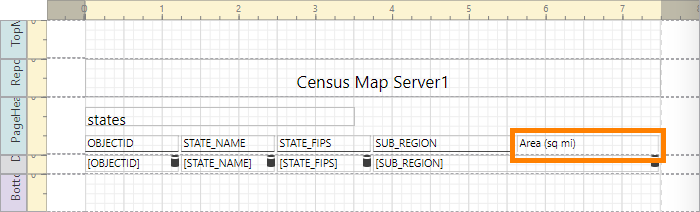
Meaningful column heading for the Area column
-
Insert a column to the right of the [SUB_REGION] control.
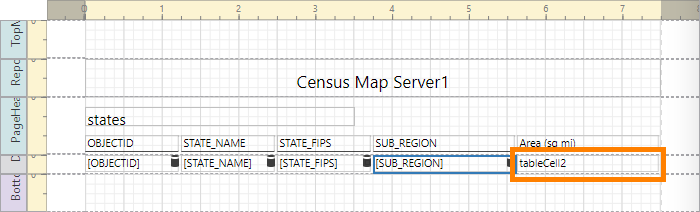
New column added to the table in the Detail band
-
Click Field List
 to open the Field List.
 -
Expand Census Map Server1 to show the
statestable, and then click states to show the fields.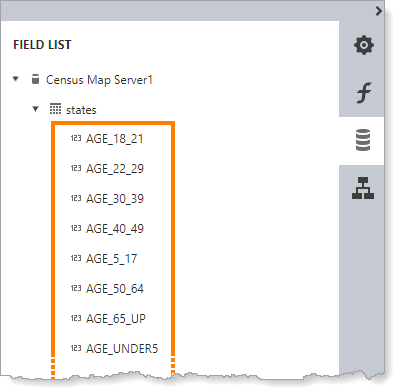
Fields in the
stateslayer that are available to add to the report -
Locate SQMI in the Field List and drag it to tableCell2.
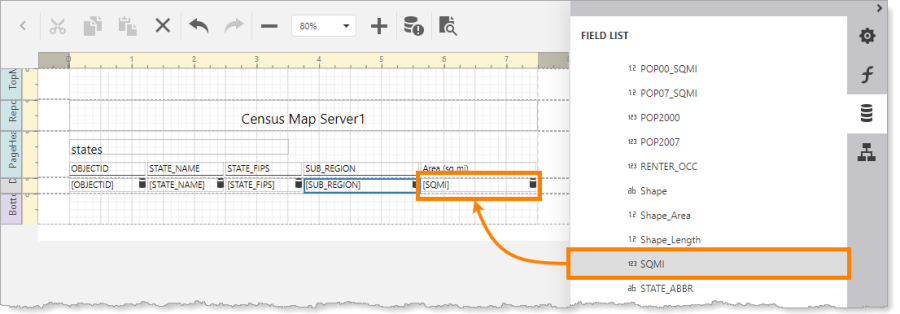
Add the
SQMIfield to the layout
-
Step 3: Configure the report's title
In this step, you will change the control in the Report Header into a meaningful title for the report.
-
Double-click the Census Map Server1 control to make it editable.
-
Type Areas of US States and then click anywhere outside the control.
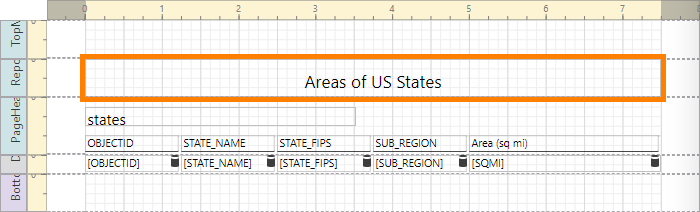
Updated report title
You may also want to change or remove the states control in the Page Header.
Step 4: Preview the report
The Preview function allows you to run the report from within Report Designer. This provides a quick way to test your reports while you are designing them.
To preview a , your browser must allow pop-ups from apps.vertigisstudio.com (cloud ) or from your domain (on-premises ).
-
Click Preview
 .
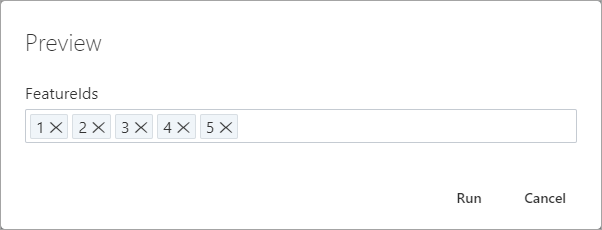
.You are prompted to enter one or more feature IDs.
-
Enter the following feature IDs:
1 2 3 4 5 To enter a feature ID, type the ID and then press Tab or Enter.
If these IDs don't exist, use the ArcGIS REST Services Directory to query the map service for valid OBJECTIDs to use.
-
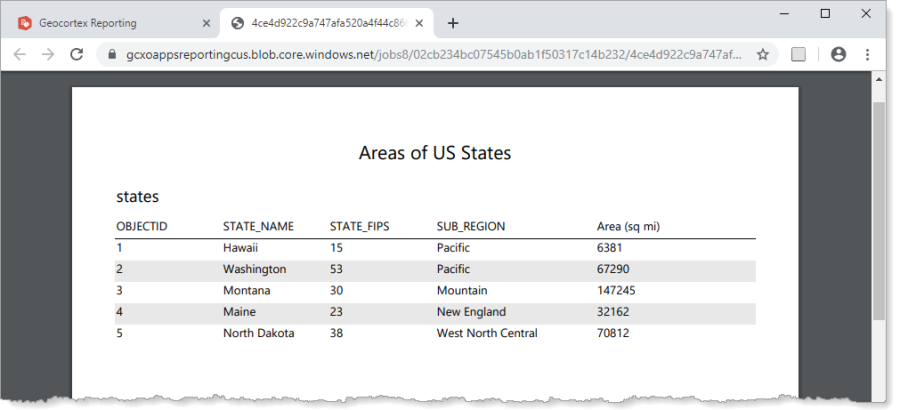
Click Run.
VertiGIS Studio Reporting generates the report and opens it in a new browser tab.
Now that you can see the report's output, you may want to return to Report Designer and modify the report's formatting or content. As a report author, you will typically create a first draft of the report, preview it, make some improvements, preview it again, and so on, until you are satisfied with the result. You would then configure an application to host the report and test it in the host environment. Finally, you would share the report with end users so they can run the report from the host application.
Step 5: Save the report
-
Press Ctrl+S or click File | Save As.
-
Enter a name for the report item.
-
Click Save.
-
Click away from the File panel to close the panel.