Calculate a Running Summary
The Summary Running property in the Label, Character Comb, and Table Cell controls allows you to define a summary expression for a group.
This page includes the steps required to count the number of items in a group. The example report will be based on earthquake data and will group earthquakes by year. The calculated running summary will count the number of earthquakes in each group.
Step 1: Create the Report Using the Layer Report Wizard
- In Report Designer, select File.
- In the panel that appears, select New.
- In the panel that appears, double-click Layer Report.
- In the dialog that appears, select Use a new ArcGIS layer or table, and then click Next.
- For the data source name, enter
Earthquakes. -
For the ArcGIS Service URL, enter:
https://sampleserver6.arcgisonline.com/arcgis/rest/services/Earthquakes_Since1970/FeatureServer/ - Click Next.
- Select Earthquakes1970 and then click Finish.
Step 2: Configure the Group Header Band
- Open the Properties
 panel.
 - To add the Group Header band, click the Insert Group Header Band icon at the top of the panel.
- Select the Table control that shows the column headers in the Page Header band.
- Drag the table into the bottom of the Group Header band.
- Expand the Group Header band so that it can fit another label control at the top of the band.
- Open the Field List
 .
. - Expand the data source, and then expand the query.
- Drag the year_ field to the top of the Group Header band.
- Select the Group Header band and then open the Properties panel.
- Under the Actions panel, expand Group Fields.
- Click the + button to add a field.
-
Set Group By to year_.
With the Group By property set to year_ the earthquake items in the report will be grouped by the year that they occurred. The Group Header band will appear once for every group (year).
Step 3: Configure a Group Footer Band
- In the Properties panel, click the Insert Group Footer Band icon.
- Select the Group Footer band.
- Add a Label control to the left side of the Group Footer band.
- Set the Text property of the label control to
Total
Step 4: Configure a Running Total
- Drag another Label control to the right of the Total Label control.
- In the Properties panel, open the Actions panel and expand the Summary property group.
-
Set the Running property to Group.
Setting the Running property to Group enables the Summary function in the Expression Editor.
- Open the Expressions
 panel.
 -
Click the ... button for the Text property.
The Expression Editor opens.
-
In the bottom left column, expand the Functions group.
- Select Summary from the list of functions.
-
In the bottom middle column, double-click the sumCount() function.
The function appears in the expression builder.
-
In the bottom left column, select Fields.
A list of fields from the query appear in the column to the right.
-
Double click year_ .
The field appears within the function's brackets.
Your expression should look similar to the following:
sumCount( [year_] ) -
Click OK to finish editing the expression.
-
Your report should look similar to the following:

The layout with all steps completed
Step 5: Preview the Configuration
- Click the Preview
 button from the toolbar.
 - In the FeatureIds parameter, enter the following OBJECTIDs:
1, 2, 51, 52, 101, 102 - Click Run.
-
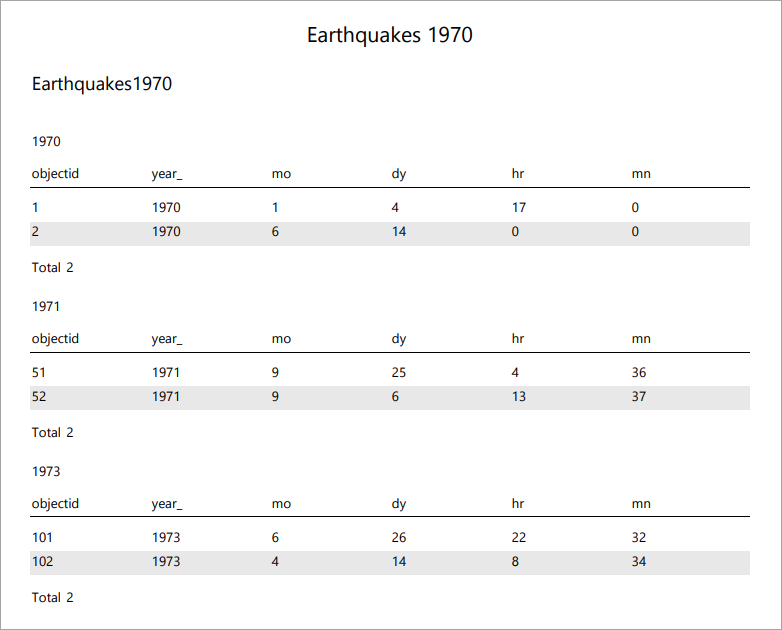
Your report should look similar to the following:

The Group Footer band displays a running summary of the number of items in each group
See Also...
Tech Tip: How to build a summary report with aggregations of feature data