Configure a Chart Control
The Chart control allows you to add charts of various types to reports—bar charts, pie charts, line charts, and more. Charts can plot data from external databases, ArcGIS map services, and ArcGIS feature services.
VertiGIS Studio Reporting supports complex charts with many parts. Because of the potential complexity, it is easiest to start with simple charts and build your knowledge incrementally.
The charting documentation includes the following:
-
Chart Terminology: Introduces the terms that you need to understand for charting.
-
Main Steps to Create a Simple Chart: Provides a generic procedure that outlines the steps to add a simple chart to an existing report. This section is appropriate for advanced users or as a refresher after you have gained some experience with charts.
-
Get Started with Charts: Includes a tutorial that creates a bar chart with arguments and values that come from fields in a feature service. The feature service is public, so you can create the chart as you follow the instructions. At the end of the tutorial, you will have a working chart. You can then improve the chart following the instructions in Enhance Your First Chart.
This topic also includes a Troubleshooting section that you can refer to if the chart is blank when you preview the report.
-
Calculate Summaries in Charts: Introduces summary functions and provides a tutorial to create a pie chart using a summary function. The data comes from a public feature service, so you can create the chart as you follow the instructions. At the end of the tutorial, you will have a working chart.
You can then improve the chart following the instructions in Enhance the Chart. This section includes how to show coded value domain descriptions instead of codes.
Chart Terminology
Chart terminology is also given in the Glossary. To open the Glossary, click the Glossary tab next to the Contents tab.
-
Data Point: A data point is one item in a data set.
-
Series: In a chart, a data set is called a series.
-
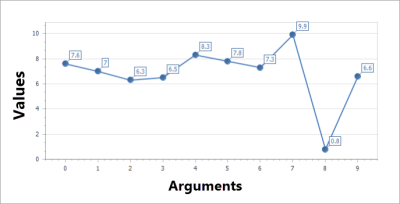
View: The way that a series is represented in a chart is called the view. Some common views are pie, bar, point, and line.
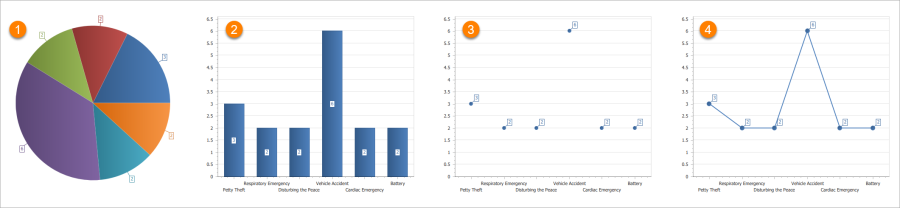
Common views: pie (
 ), bar (
 ), point (
 ), and line (
 )
)The view determines how a data point is represented:
-
Pie: In a pie series, each data point is a slice of the pie.
-
Bar: In a bar series, each data point is a bar.
-
Point: In a point series, each data point is a point.
-
Line: In a line series, each data point is a point that is connected by lines to the adjacent points.
-
-
Axes: Many views have axes that form the essential grid of reference for the chart. A two-dimensional chart with axes has a horizontal axis (the X-axis) and a vertical axis (the Y axis).
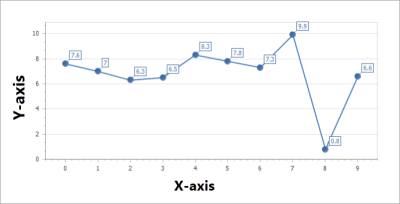
Chart with an X-axis and Y-axis
-
Argument, Value: In a two-dimensional chart, a data point can be represented as (X, Y). The X coordinate is called the argument and the Y coordinate is called the value:
data point = (argument, value)
Axes corresponding to arguments and values
Main Steps to Create a Simple Chart
The steps below outline how to create a simple chart. The chart is simple in the following sense:
-
The chart starts with a single series, rather than multiple series.
-
The chart uses a single Y coordinate, rather than multiple Y coordinates.
-
The chart gets the Y coordinate directly from a field in the data source, rather than aggregating the data.
-
The chart uses the default legend, rather than a custom legend.
To include a simple chart in a report:
-
Add the Chart control to the desired band in the report's layout.
-
If the chart will plot a summary of the report's detail data, add the Chart control to the Report Header or Report Footer band.
-
If the chart will plot a summary of group data, add the Chart control to the Group Header or Group Footer band.
-
If the chart will plot data for each record, add the Chart control to a band that is repeated for each record, like the Detail band.
-
-
Open Chart Designer:
Select the Chart control on the design surface and click Run Designer.
-
If the report is bound to more than one data table, bind the chart to the table that the chart's data will come from:
Make sure the chart is selected in Chart Structure. In the Properties panel, configure the Data Source and Data Member settings.
If the report is only bound to one table, the chart will use the report's table by default. In this case, you do not need to configure Data Source and Data Member.
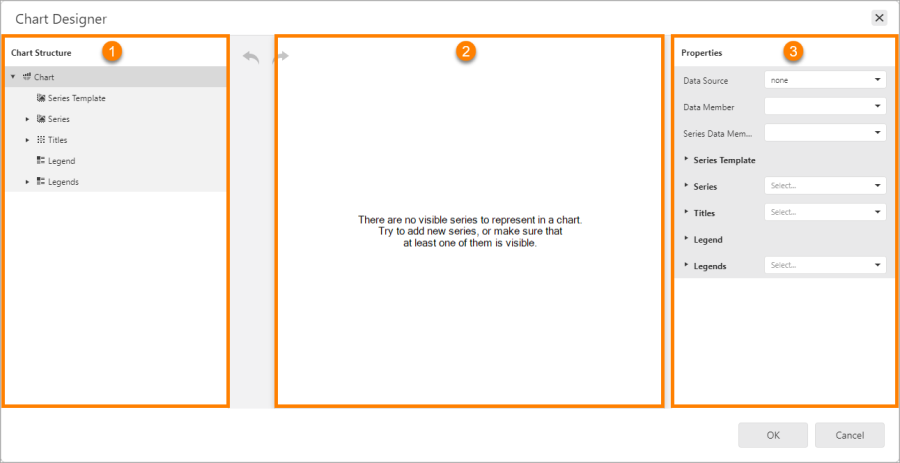
Chart Designer, showing the Chart Structure (
), preview area (), and Properties panel () -
Specify the set of data points to plot (the series).
Each data point in a series is defined by two values: an argument (X coordinate) and a value (Y coordinate).
-
Add a series:
In Chart Structure, click Series. Click the Add icon and select the view.
-
Configure the source of the arguments:
In the Properties panel, set Argument Data Member to the desired field.
-
Configure the source of the values:
In the Properties panel, set Value Data Members | Value to the desired field.
Alternatively, select a Summary Function | Function and, if the function requires an argument, set Summary Function | Argument to the field that you want the function to operate on.
Chart Designer shows a preview of the chart. The preview uses sample data, so the labels on the series and axes may appear unrealistic.
To preview the chart using the actual data, close Chart Designer and preview the report in Report Designer.
-
-
Click OK to close Chart Designer.
-
Click Preview
 to preview the report.
Additional Configuration
The table below summarizes where to configure various aspects of a simple chart. Note that the table only lists aspects that are commonly customized. It is not a complete list.
Location of common configuration settings for a simple chart
|
Component |
Aspect |
Location |
|---|---|---|
|
Chart |
Title |
In Chart Structure, click Titles. Click the Add icon |
|
Predefined Palettes |
In Report Designer, select the Chart control. Configure the Palette Name setting in the Appearance section of the Properties panel. |
|
|
Series |
X Coordinates |
In Chart Structure, select the series. Configure the Argument Data Member setting. |
|
Y Coordinates |
In Chart Structure, select the series. Expand Value Data Members and configure the Value setting. |
|
|
Labels |
In Chart Structure, select the series. Configure the label's properties in the Label section of the Properties panel. |
|
|
Labels Visibility |
In Chart Structure, select the series. Configure the Labels Visibility setting in the Properties panel. |
|
|
Axes
|
X-Axis |
In Chart Structure, expand Diagram and click Primary Axis X. Configure the axis' properties in the Properties panel. |
|
Y-Axis |
In Chart Structure, expand Diagram and click Primary Axis Y. Configure the axis' properties in the Properties panel. |
|
|
Legend |
Text |
In Chart Structure, select the series. Configure the Legend Text Pattern setting in the Properties panel. |
|
Appearance |
In Chart Structure, click Legend. Configure the legend's appearance in the Properties panel. |
|
|
Title |
In Chart Structure, click Titles. Click the Add icon |