Visualization Module
The Visualization Module is a container that hosts visualization providers. There are several ways to visualize layers:
-
Default symbology
-
Clustering
-
Heat maps
-
Administrator-defined layer styles
-
User-defined layer styles.
For additional information, see LayerStyles Module, ClusterLayers Module, and HeatMaps Module.

Features shown individually (left), clustered (center), and in a heat map (right)
The Visualization Module also implements the Visualization Options panel, where users can change the current visualization and its settings. Activating the Visualization Module's VisualizationView opens the Visualization Options panel.
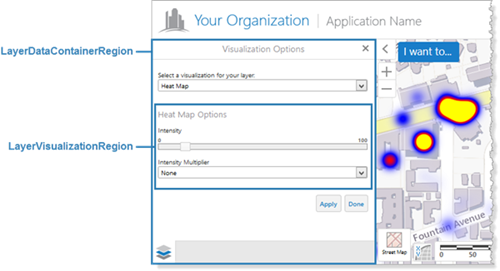
By default, VisualizationView is hosted in LayerDataContainerRegion. VisualizationView contains LayerVisualizationRegion, which hosts the settings for the currently selected visualization.

Regions used for the Visualization Options panel
The Visualization Module provides two commands and two events, which you can use in hyperlinks and workflows:
-
The
ShowVisualizationViewcommand opens the Visualization Options panel for the specified feature layer, provided the feature layer has one or more visualizations configured for it. Note that if a map Service ID is used withShowVisualizationView, then the Visualization Options panel only applies to the first layer from the service.-
VisualizationViewActivatedEventis raised when the Visualization Options panel opens. -
LayerVisualizationChangedEventis raised when the type of visualization changes, for example, when the user selects a different visualization from the Visualization Options panel.
-
-
The
RemoveVisualizationcommand removes the current visualization from the specified feature layer, if there is an active visualization. At most one visualization can be active at a time.
For more information, see Viewer Commands and Events.
Configuration Properties
Module
No configuration properties
Views
-
VisualizationView: Noconfigurationproperties
View Models
-
VisualizationViewModel:-
containerRegionName: The name of the region to display withinVisualizationView's region. The default isLayerVisualizationRegion, which is used by the ClusterLayers Module and the HeatMaps Module to display their user-configurable settings. -
defaultDisplayName: The text for the visualization option that means "do not show a visualization". The default text is None. Visualization options appear in the drop-down list on the Visualization Options panel. -
containerTitle: The title that appears at the top of the Visualization Options panel. The default language string,@language-visualization-title, is set to Visualization Options by default. -
visualizationProviders: An array of visualization providers. Each provider provides a way to visualize features on the map. By default, there are three providers, one for layer styles, one for heat maps, one for clustering. Each visualization provider has the following properties:-
type: The provider type. -
viewID: The ID of the view to show in the container,containerRegionName. -
displayName: The text for this provider's visualization option, which appears in the drop-down list on the Visualization Options panel. -
libraryId: (optional) The ID of the library containing your custom-developed visualization providers. If you are using the built-in visualization providers only, omit thelibraryIdproperty.
-
-