LayerStyles Module
Layer styles enable end users to re-symbolize layers on the map. The LayerStyles Module implements the layer styles visualizationProvider, which is hosted by the Visualization Module.
There are two ways to give end users control of layer symbolization:
-
In Manager, create layer styles that end users can select in a list.
-
Enable end users to create new layer symbology and turn the symbolization on and off.
Symbolization can only be modified for feature layers or layers that belong to a dynamic layers-enabled map service. Symbolization must be enabled in Essentials Manager. Feature layers have symbology enabled by default. For more information, see Symbolization.
The widget configuration settings control two types of symbology:
-
Simple: The Simple symbology type allows users to define the style of a single symbol for all the features in a layer.
-
Attribute: The Attribute symbology type allows users to style features in a layer based on the information in a specific field. For example, if a layer includes a field with elevation data, the symbology could be rendered with different colors, each color representing an elevation range. You can use up to twelve different colors.
The LayerStyles Module uses SymbologySettings and AttributeSymbologySettings widgets to provide default layer style definitions. Widgets are configured in the idgets section of the viewer configuration files.
Commands
You can activate the re-symbolization user interface with the ShowVisualizationView command. You can remove re-symbolization with the RemoveVisualization command.
User Experience
Users can configure layer styles in the viewer from the Visualization Options panel. They can enable either a preconfigured layer style defined in Essentials Manager or define a custom layer style.
For example, assume the default layer style for a Tax Parcel layer is defined as shown in the following image, where the tax parcels are within the rectangular areas on the map:
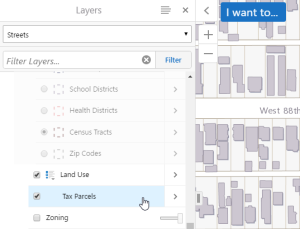
Default layer style visualization
Use a Preconfigured Layer Style
To use a preconfigured layer style:
-
On the Layers panel, locate the layer to which you want to apply a preconfigured layer style.
-
Click the
 Action button next to the layer name to display a list of layer options.
 -
Click Turn on/off layer visualizations to open the Visualization Options panel.
-
Select a preconfigured layer style from the drop-down list.
-
Click Apply, and then click Done or close the Visualization Options panel.
Create a Custom Layer Style
To create a custom layer style:
-
On the Layers panel, locate the layer for which you want to create a custom style.
-
Click the
Action button to the right of the layer name to display a list of layer options. -
Click Turn on/off layer visualizations to open the Visualization Options panel.
-
Select Custom Layer Style in the drop-down list.
-
Select Simple under Choose Symbology Type.
-
Choose your fill color for the tax parcels in the Color selector, your border color for the tax parcels in the Outline Color selector, then click Apply.
As shown in the following image, the fill color is a solid color.
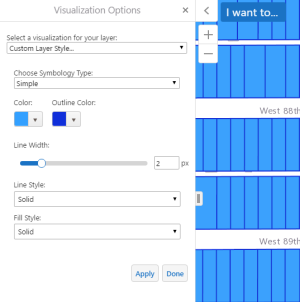
Visualization Options panel with fill color and outline color defined for the layer
-
Use the Line Width slider or click the numeric field and click the up/down arrows to change the pixel setting for the line width.
-
Use the Line Style list to choose from solid or dot and dash lines.
-
Use the Fill Style list to choose from a solid or patterned fill style.
-
-
To change the transparency/opacity setting to permit underlying layer features to show through, click the down arrow under Color and set the slider for the "a" (alpha) setting of the 'rgba' values to something less than 100% and click Apply.
In the following image, the slider is moved from 100% to 0%.
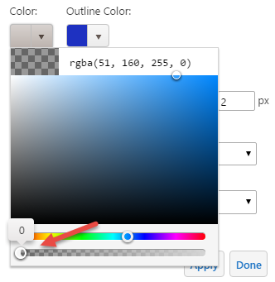
Setting the slider for the fill color to 0%
And the resulting Tax Parcels layer appears with no fill color and a dark blue outline color:
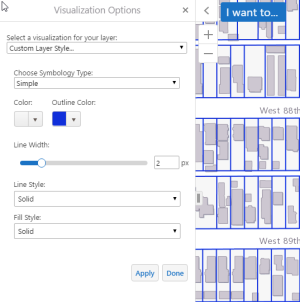
Fill color set to 0% and the outline color set to dark blue
Similar symbolization changes can be used to customize the layer style when selecting the Attribute symbology type.
Configuration Properties
Module
No configuration properties
Views
-
LayerStyleSelectorView: Noconfigurationproperties
View Models
-
LayerStyleSelectorViewModel: Noconfigurationproperties
Widgets
-
AttributeSymbologySettings: Configures the default behavior for Attribute Symbology. This type of symbology allows users to style features in a layer based on the information in a specific field. For example, if a layer included a field with elevation data, the symbology could be rendered with up to twelve different colors, each color representing an elevation range.-
maxRenderClasses: Sets the maximum number of classes that can be distinguished for the configured attribute. For example, you may wish to configure three classes for three different tree species that your layer identifies. The default value is12. Note that increasing the default to a value greater than 12 can impact performance. -
maxSamples: Defines how many features should be sampled to determine the values of a layer's render classes. The default value is1000. -
defaultPointColor: An array that defines the default color for point features in RGBA format. The default value is[150, 150, 150, 0.8]. -
defaultPointSize: The default size of a point feature in pixels. The default value is12. -
defaultLineColor: An array that defines the default color for line features in RGBA format. The default value is[75, 75, 75, 1]. -
defaultLineWidth: The default width of a line feature in pixels. The default value is2. -
defaultFillColor: The default fill color for features in RGBA format. The default value is[150, 150, 150, 0.3]. -
defaultSymbologySettingsConfig:-
selectOutlineColor: Allows the user to select an outline color. The default value istrue. -
alwaysUseColorSwatches: Allows the user to always choose colors using color pickers. The default value isfalse. -
numberOfColorSwatches: Defines how many color pickers should be available from the attribute symbology settings. The default value is6. -
transparency: Sets the user configuration options for the transparency slider. These properties accept values between 0 and 100 percent, where0is opaque and100is transparent.-
min: Sets the minimum transparency value available, in percent. The default value is0. -
max: Sets the maximum transparency value available, in percent. The default value is90. -
value: Sets the initial transparency value, in percent. The default value is10. -
step: Sets the increment to use when the user increases or decreases the transparency value, in percent. For example, if the value is 10, there are 10 unique transparency values that can be picked between 0 and 100. The default value is5.
-
-
lineWidth: Sets the user configuration options for the symbol line width slider.-
min: Sets the minimum configurable width of the line, in pixels. The default value is0. -
max: Sets the maximum configurable width of the line, in pixels. The default value is5. -
value: Sets the initial configured line width value, in pixels. The default value is2. -
step: Sets the increment to use when the user increases or decreases the line width, in pixels. The default value is1.
-
-
markerSize: Sets the user configuration options for the marker size slider.-
min: Sets the minimum configurable marker size, in pixels. The default value is1. -
max: Sets the maximum configurable marker size, in pixels. The default value is50. -
value: Sets the initial configured marker size value, in pixels. The default value is16. -
step: Sets the increment to use when the user increases or decreases the marker size, in pixels. The default value is1.
-
-
markerStyles: An array of objects that define available marker styles. By default, the styles included arecircle,diamond,cross,x, andsquare. You can configure additional styles that exist in the ArcGIS API for JavaScript.-
style: A string that references an available marker style. -
label: The label to display for the marker style in the viewer. You can use text or a text key. For more information on using text keys, see Configure User Interface Text. The default values for marker style text keys are@language-symbology-settings-marker-style-*, where*is the marker style —circle,diamond, and so on.
-
-
lineStyles: An array of objects that define available line styles. By default, the styles included aresolid,dash,dot, anddashdot. You can configure additional styles that exist in the ArcGIS API for JavaScript.-
style: A string that references an available line style. -
label: The label to display for the line style in the viewer. The line style is the style of the border of the feature marker. You can use text or a text key. For more information on using text keys, see Configure User Interface Text. The default values for line style text keys are@language-symbology-settings-line-style-*, where*is the marker style —solid,dash, and so on.
-
-
fillStyles: An array of objects that define available fill styles. The fill is the most dominant pattern of the feature marker. By default, the styles included aresolid,forwarddiagonal,backwarddiagonal,cross,horizontal, andvertical. You can configure additional styles that exist in the ArcGIS API for JavaScript.-
style: A string that references an available fill style. -
label: The label to display for the fill style in the viewer. You can use text or a text key. For more information on using text keys, see Configure User Interface Text. The default values for fill style text keys are@language-symbology-settings-fill-style-*, where*is the marker style —solid,forward-diagonal,backward-diagonal, and so on.
-
-
-
-
SymbologySettings: Configures the default behavior for Simple Symbology. -
alwaysUseColorSwatches: Defines whether color pickers should always be available. The default value isfalse. -
numberOfColorSwatches: Defines how many color pickers should be available from the attribute symbology settings. The default value is6. -
transparency: Sets the user configuration options for the transparency slider. These properties accept values between 0 and 100 percent, where0is opaque and100is transparent.-
min: Sets the minimum transparency value available, in percent. The default value is0. -
max: Sets the maximum transparency value available, in percent. The default value is90. -
value: Sets the initial transparency value, in percent. The default value is10. -
step: Sets the increment to use when the user increases or decreases the transparency value, in percent. For example, if the value is 10, there are 10 unique transparency values that can be picked between 0 and 100. The default value is5.
-
-
lineWidth: Sets the user configuration options for the symbol line width slider.-
min: Sets the minimum configurable width of the line, in pixels. The default value is0. -
max: Sets the maximum configurable width of the line, in pixels. The default value is5. -
value: Sets the initial configured line width value, in pixels. The default value is2. -
step: Sets the increment to use when the user increases or decreases the line width, in pixels. The default value is1.
-
-
markerSize: Sets the user configuration options for the marker size slider.-
min: Sets the minimum configurable marker size, in pixels. The default value is1. -
max: Sets the maximum configurable marker size, in pixels. The default value is50. -
value: Sets the initial configured marker size value, in pixels. The default value is16. -
step: Sets the increment to use when the user increases or decreases the marker size, in pixels. The default value is1.
-
-
markerStyles: An array of objects that define available marker styles. By default, the styles included arecircle,diamond,cross,x, andsquare. You can configure additional styles that exist in the ArcGIS API for JavaScript.-
style: A string that references an available marker style. -
label: The label to display for the marker style in the viewer. You can use text or a text key. For more information on using text keys, see Configure User Interface Text. The default values for marker style text keys are@language-symbology-settings-marker-style-*, where*is the marker style —circle,diamond, and so on.
-
-
lineStyles: An array of objects that define available line styles. By default, the styles included aresolid,dash,dot, anddashdot. You can configure additional styles that exist in the ArcGIS API for JavaScript.-
style: A string that references an available line style. -
label: The label to display for the line style in the viewer. The line style is the style of the border of the feature marker. You can use text or a text key. For more information on using text keys, see Configure User Interface Text. The default values for line style text keys are@language-symbology-settings-line-style-*, where*is the marker style —solid,dash, and so on.
-
-
fillStyles: An array of objects that define available fill styles. The fill is the most dominant pattern of the feature marker. By default, the styles included aresolid,forwarddiagonal,backwarddiagonal,cross,horizontal, andvertical. You can configure additional styles that exist in the ArcGIS API for JavaScript.-
style: A string that references an available fill style. -
label: The label to display for the fill style in the viewer. You can use text or a text key. For more information on using text keys, see Configure User Interface Text. The default values for fill style text keys are@language-symbology-settings-fill-style-*, where*is the marker style —solid,forward-diagonal,backward-diagonal, and so on.
-