Introduction to VertiGIS Studio Reporting
Welcome to VertiGIS Studio Reporting. VertiGIS Studio Reporting enables you to create sophisticated, professional-looking reports that include spatial and non-spatial data from ArcGIS map services, tables, databases, and other data sources.
Reports are authored using a web-based tool called VertiGIS Studio Report Designer. Report Designer has an extensive suite of tools for laying out reports, specifying the data that you want to include, and presenting the data using charts, tables, and other configurable elements. Sharing reports with end users allows them to create on-demand, print-ready PDF reports about maps and features, using data from the user's current session.
End users run reports from VertiGIS Studio viewers and ArcGIS Web AppBuilder apps. If you use VertiGIS Studio Workflow, you can also configure workflows to run reports.
To configure a Web AppBuilder app to host a report, you use a custom widget that was developed by VertiGIS Studio for this purpose. The user clicks the widget to run the report.
VertiGIS Studio Reporting can run in two environments—in the cloud or on premises. In the cloud version of VertiGIS Studio Reporting, you use the cloud offering of VertiGIS Studio Report Designer to design reports. Reports are saved to VertiGIS Studio Reporting in the cloud, with an item for each report in your ArcGIS Online account. Reports run in VertiGIS Studio Reporting in the cloud.
In the on-premises version, you use your on-premises deployment of VertiGIS Studio Report Designer to design reports. Reports are saved to your on-premises deployment of VertiGIS Studio Reporting, with an item for each report in your Portal for ArcGIS account or in an ArcGIS Online account. Reports run in your on-premises deployment of VertiGIS Studio Reporting.
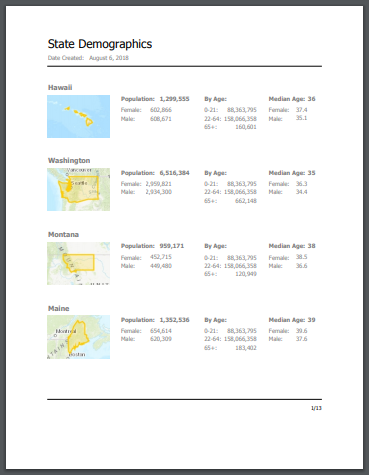
Example of a VertiGIS Studio report
See also...
Main Steps to Create a Report
The main steps to create and run a VertiGIS Studio
-
Create a new
You can either create a
-
Add a data source to the report.
This allows you to include data from the data source in the report.
Before you can add a data source to a report, you must configure the data source's connection information. You only need to do this once, and then you can add the data source to any report that you author.
-
Configure the query that will get the data for the report.
You may want to add filter conditions that restrict the records that the query returns. A common type of filter condition used in layer reports restricts the records to the features that are currently selected by the user.
-
Design the
Add bands that define the report's structure, like headers, footers, and data areas. Add data fields and other content to the report. Format the content.
-
Preview the
Run the
-
Save the
-
Share the
To share the
-
Configure an application to host the
-
Run the
What's next?