Key Concepts
Reports
A report is a formatted presentation of a particular type of information. VertiGIS Studio Reporting specializes in presenting data and images related to web maps.
Reports are designed by report authors (administrators) using a web-based tool called VertiGIS Studio Report Designer. They are saved to the VertiGIS Studio Reporting service, with an item in the content area of the author's ArcGIS account. To allow users to run a report, the author shares the ArcGIS item with them. End users use the reports designed by the author to create on-demand, print-ready reports about maps and their features.
End users run reports from web applications that the author has configured to host the reports (host applications). The output report is a PDF.
VertiGIS Studio Report Designer
VertiGIS Studio Report Designer provides an extensive suite of tools for laying out
Report Designer has a built-in Preview environment for running
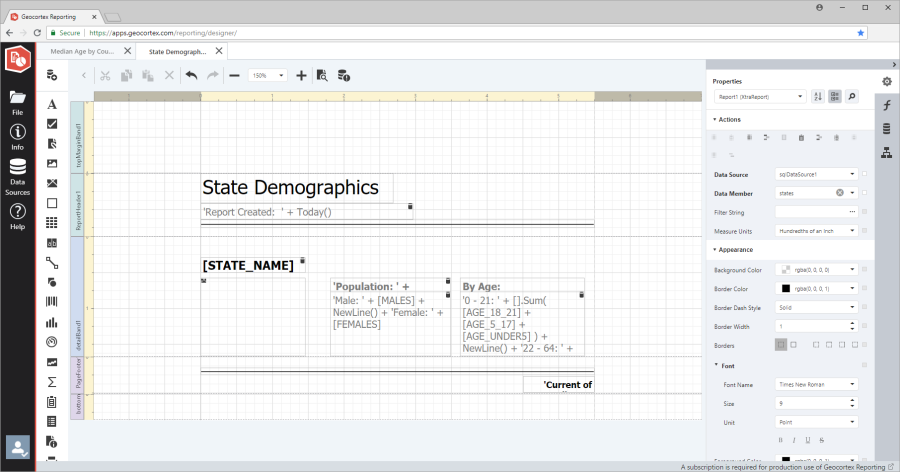
Example of a report open for editing in VertiGIS Studio Report Designer
Data
When you author a report in Report Designer, one of your tasks is to specify the data that you want to include in the report. VertiGIS Studio reports can include spatial and non-spatial data from ArcGIS services and tables, or from databases like SQL Server and Oracle. When a user runs a report, the data references in the report are populated with their values from the data source. A single report can get data from multiple data sources.
See also...
Data Sources
The data that you include in reports is stored in data sources. To get data from a data source like an ArcGIS service or a database, VertiGIS Studio Reporting needs to know how to connect to the data source. To provide this information, you configure the data source's connection information in Report Designer. You then add the data source to your report and configure the query that will get the data. To limit the data that is included in a report, you can place conditions on the query or pass input parameters to the report.
You only need to configure a data source's connection information once. After that, you can use the data source in any report that you author.
See also...
Report Parameters
Report parameters allow you to pass inputs to a report when the report runs. VertiGIS Studio Reporting supports passing ArcGIS feature IDs as inputs to reports. Typically, a user will select some features on the map or from search results and then run a report on the selected features. Report parameters make it possible to include just those features that the user has selected.
See also...
Use the Current Features as Report Inputs
Subreports
A subreport is a report within a report. Subreports are used to present related data from a secondary data source. In one common scenario, a report includes features from an ArcGIS layer and, for each feature, related data from an external database.
See also...
Include Related Data in a Report
Host Applications
A host application is a web application from which users can run VertiGIS Studio
VertiGIS Studio Reporting supports the following types of host applications:
- VertiGIS Studio Web
- Geocortex Viewer for HTML5
- ArcGIS Web AppBuilder
See also...
Bands
Required Bands
Every
Top Margin, Bottom Margin: The Top Margin and Bottom Margin bands reserve areas at the top and bottom of the page. The Margin bands appear on every page of the report.
Detail Band: The Detail band contains controls, each of which defines something to include in the
You cannot delete the Top Margin, Bottom Margin, or Detail band.
See also...
Controls
A control is an element that you add to a
See also...
Master-Detail Relationship
The Master-Detail Relationship defines how tables from the same data source are related to one another.
Define a Master-Detail Relationship
You must have two queries to the same data source in order to define a Master-Detail Relationship.
- Open the Field List
 .
. - Select the report's data source.
- Click the Edit Master-Detail Relationship
 button to view the Master-Detail Relation Editor.
 - In the dialog that appears, define the relationship between tables.
- Once you have defined the master-detail relationship, the relationship query appears nested under the master table in the Fields List.
To expose related data in the report, you must define the relationship on the master report table. The master report table is the table whose query is filtered by the report parameter.
See also...