Include Related Data in a Report
You may want to create a report that includes primary data from one table and related data from a second table. In one common scenario, a report may include attribute values from an ArcGIS layer and, for each feature, related data from a database.
A report that includes primary and secondary data in a one-to-one or one-to-many relationship is called a Master-Detail report. In order to include related data, the primary and secondary tables or layers must have a field in common, so each primary record relates to the correct secondary records. For example, one table could have a FIPS field that contains the state's FIPS code and the other table could have a STATE_FIPS field that contains the state's FIPS code. When the value in the FIPS field equals the value in the STATE_FIPS field, the data in the two records are for the same state.
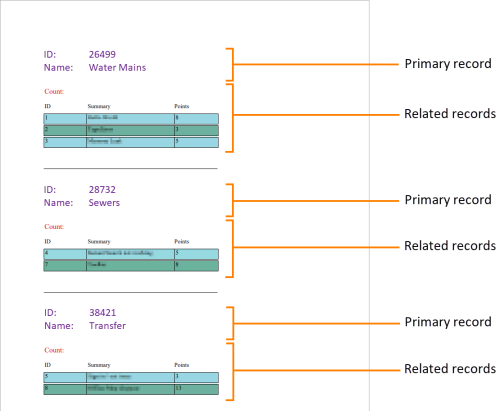
Example of a one-to-many Master-Detail report
There are two ways to create a Master-Detail report: using a subreport or using a detail band. The method that you use depends on the number of data sources:
-
If the primary and secondary data come from different data sources, then you must use a subreport to create a Master-Detail report.
-
If the primary and secondary data come from two different tables in the same data source, you can use either a subreport or a detail band to create a Master-Detail report.
The tutorial below shows you how to create a Master-Detail report using a subreport. The subreport method allows you to create any Master-Detail report, regardless of whether the primary data and related data come from the same data source or from different data sources.
Before you Begin
VertiGIS Studio Reporting can run in two environments—in the cloud or on premises. To do this tutorial, you must have an ArcGIS identity that gives you access to one of these environments.
-
Cloud: To do this tutorial in the cloud environment, you need an ArcGIS Online account. You can use a public account or an organizational account. You can get a public account here for free.
-
On Premises: To do this tutorial using on-premises Reporting, VertiGIS Studio Reporting must be installed and registered either with Portal for ArcGIS or with ArcGIS Online. See
-
Portal for ArcGIS: If VertiGIS Studio Reporting is registered with your organization's on-premises installation of Portal for ArcGIS, do this tutorial using the account that you use to access your organization's portal.
The tutorial uses a public ArcGIS Online map service. If your organization's portal does not have access to the Internet, you will have to substitute a map service that you have access to.
-
ArcGIS Online: If VertiGIS Studio Reporting is registered with ArcGIS Online, do this tutorial using your ArcGIS Online account.
-
Main Steps to Create a Master-Detail Report Using a Subreport
The main steps to create a Master-Detail report that uses a subreport are as follows:
- Create a new report.
- Configure the master data source and add it to the report.
- Design the master report.
- Add a subreport and open it.
- Configure the subreport's data source and add it to the subreport.
- Create a report parameter for the subreport.
- Add a filter condition to the subreport's query.
- Design the subreport.
- Preview the subreport.
- Return to the master report.
- Bind the subreport parameter.
- Preview the report.
Tutorial - Create a Master-Detail Report Using a Subreport
In this tutorial, you will design and preview a Master-Detail report that lists one or more US states and, for each state, the counties in that state. The states data comes from a layer in an ArcGIS Online map service. The counties data comes from a layer in a different ArcGIS Online map service. Because the states and counties come from different data sources, you must use a subreport to create the report. The data sources are:
-
States:
http://sampleserver6.arcgisonline.com/arcgis/rest/services/Census/MapServer -
Counties:
http://sampleserver5.arcgisonline.com/arcgis/rest/services/Census/MapServer
Both the data sources used in this tutorial have a states and counties layer, so it would be possible to get the data from the same data source. For the sake of illustrating a scenario that uses different data sources and therefore requires a subreport, this tutorial gets the data from different data sources.
The layers used in this tutorial both have a field that contains the state's FIPS code. The field is called STATE_FIPS in both layers. The field name happens to be the same in both layers, but this is not required. You will use the STATE_FIPS field to relate the two layers. The steps to relate the two layers are as follows:
-
Create a report parameter for the subreport.
The subreport parameter represents the state's FIPS code in the subreport's data source.
-
Filter the subreport's query based on the subreport parameter.
You cannot use the subreport parameter directly in the query. Instead, you create a query parameter, use the query parameter in the query filter, and then configure an expression that binds the subreport parameter to the query parameter.
-
Bind the state's FIPS code in the master report's data source to the subreport control in the master report.
Step 1: Create a New Report
-
Open VertiGIS Studio Report Designer.
If you use VertiGIS Studio Reporting in the cloud, you can access Report Designer here.
-
Click Blank Report.
-
Press Ctrl+S to save the report. Name the report:
Median Age by County If you get a server error at any time while designing your report, try re-saving the report. It is possible that your ArcGIS session has timed out.
Step 2: Configure the Master Data Source
-
Configure the data source's connection information, if necessary.
If you have already configured the connection information for the map service at
http://sampleserver6.arcgisonline.com/arcgis/rest/services/Census/MapServer, you can skip this step. Continue at the next step.-
In Report Designer's sidebar, click Data Sources.

-
Click Add Data Source and select ArcGIS.
-
In the Name box, type:
Census (sampleserver6) When you configure a new data source, choose a meaningful name for the data source. If you change the name later, after you have added the data source to one or more reports, the data source will be removed from the reports. You will have to add back the data source under its new name and reconfigure it.
-
In the Service URL box, enter:
https://sampleserver6.arcgisonline.com/arcgis/rest/services/Census/MapServer 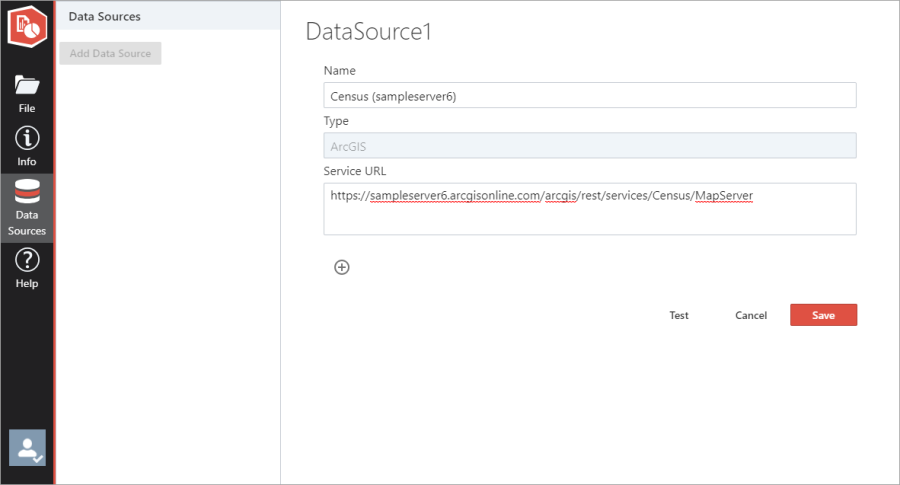
Connection information configured for the master data source
-
Click Save.
-
Click away from the Data Sources panel to close the panel.
-
-
Click Add SQL Data Source
 to open the SQL Data Source Wizard.
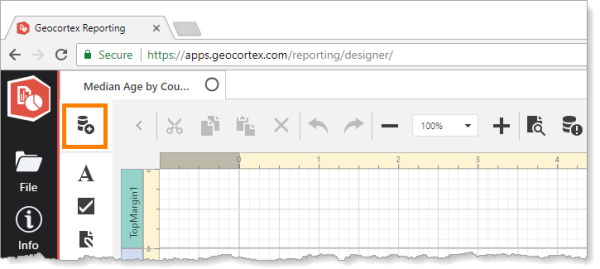
Location of Add SQL Data Source tool
-
In the list of data connections, select Census (sampleserver6).
-
In step 2 of the wizard, expand Tables to show the layers in the map service.
-
Expand states to show the attributes in the
stateslayer. -
Select the checkbox for each attribute that will be included in the report:
STATE_NAMESTATE_FIPS
-
Click Finish to close the wizard.
-
Press Ctrl+S to save the report.
Step 3: Design the Master Report
-
Open the Properties panel and expand the Actions section.
-
Click Insert Report Header Band
 .
. -
Reduce the height of the TopMargin1 band.
-
Add the report's title:
- Drag a Label
 onto ReportHeaderBand1.
 - Change the text to:
Median Age by County - Format the title as desired.
- Reduce the height of ReportHeaderBand1.
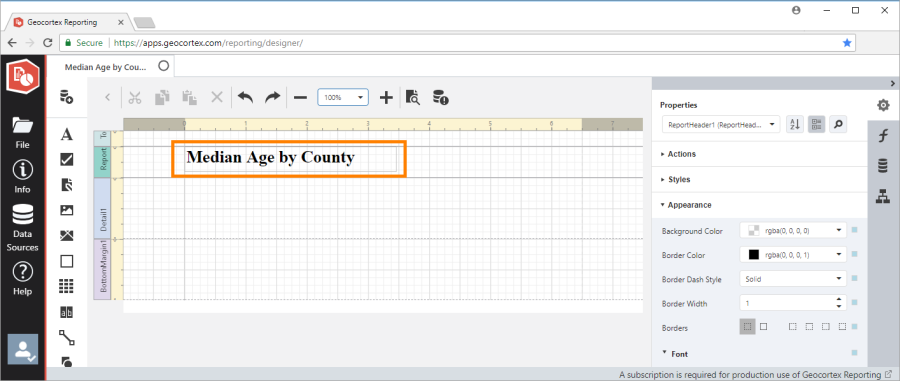
Report title in the master report's ReportHeaderBand1
- Drag a Label
-
Add content to the report body:
-
In the Field List
 , expand the data source (sqlDataSource1), and expand the states layer.
 -
Drag and drop the STATE_NAME and STATE_FIPS fields onto the Detail1 band.
On the design surface, data fields are marked with a data icon
 .
. -
Add whatever labels you want and format the content of the Detail1 band as desired.
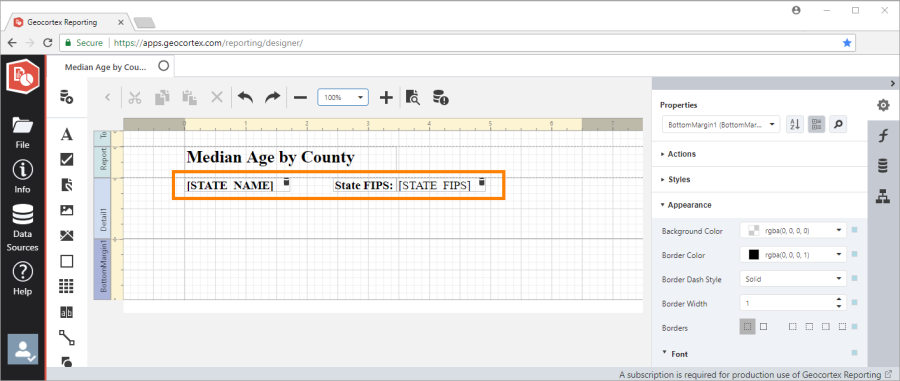
Formatted content in the master report's Detail1 band (STATE_NAME data field, "State FIPS" label, and STATE_FIPS data field)
-
-
Press Ctrl+S to save the report.
Step 4: Add a Subreport
-
Drag and drop the Subreport control
 onto the Detail1 band, below the data fields.
 -
Reduced the height of the Detail1 band.
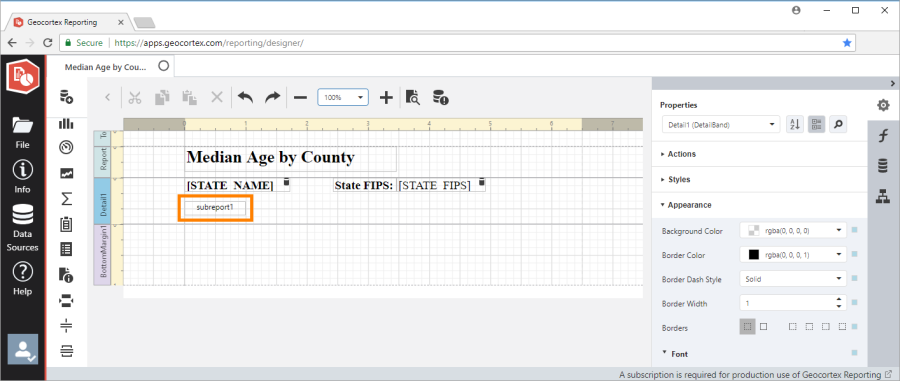
Subreport control added to the master report's Detail1 band
-
Double-click the subreport1 control on the design surface to open the subreport.
The subreport is initially blank. Note that there is no data source in the Field List—the data source that you added to the master report applies to the master report only.
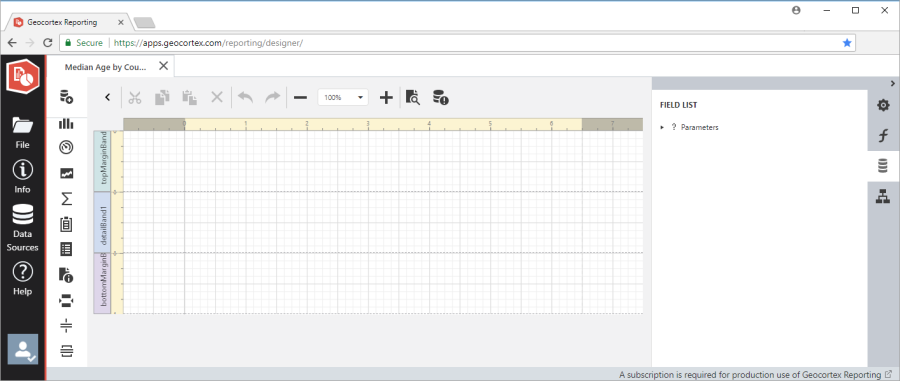
New, blank subreport
Every subreport has its own design surface. When a subreport is open in Report Designer, the configuration panels show the configuration for the subreport. In order to see the master report's configuration, you must return to the master report. To return to the master report, press Ctrl+Alt+Home or click the Navigate to parent report tool
 .
. -
Press Ctrl+S to save the report.
Step 5: Configure the Subreport's Data Source
-
Configure the data source's connection information, if necessary.
If you have already configured the connection information for the map service at
http://sampleserver5.arcgisonline.com/arcgis/rest/services/Census/MapServer, you can skip this step. Continue at the next step.-
In Report Designer's sidebar, click Data Sources.
-
Click Add Data Source and select ArcGIS.
-
In the Name box, type:
Census (sampleserver5) -
In the Service URL box, enter:
https://sampleserver5.arcgisonline.com/arcgis/rest/services/Census/MapServer -
Click Save.
-
Click away from the Data Sources panel to close the panel.
-
-
Click Add SQL Data Source
to open the SQL Data Source Wizard. -
Select Census (sampleserver5) and click Next.
-
Expand Tables to show the layers in the map service.
-
Expand Detailed Counties to show the attributes in the Detailed Counties layer.
-
Select the checkbox for the following attributes:
NAMECNTY_FIPSPOP2007MED_AGE
-
Click Finish to close the wizard.
The data source appears in the Field List.
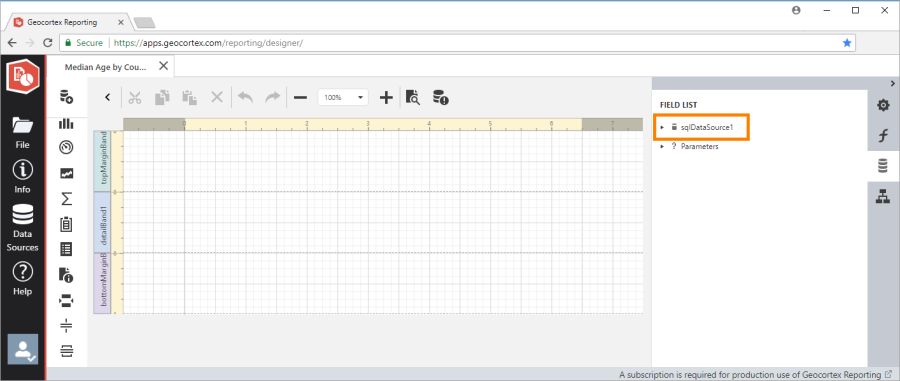
Subreport's data source in the Field List
-
Press Ctrl+S to save the report.
Step 6: Create a Report Parameter for the Subreport
-
In the Field List
, click  Parameters to show the management buttons.
 -
Click
 to add a parameter.
 A new parameter is created.
-
Click
 to edit the parameter.
 -
Configure the parameter's properties:
-
In the Name box, type the following name for the parameter:
stateFips The name can include letters, numbers, and underscore characters. It cannot include spaces or special characters.
-
In the Description box, type a description of the parameter, for example:
FIPS code for the current state
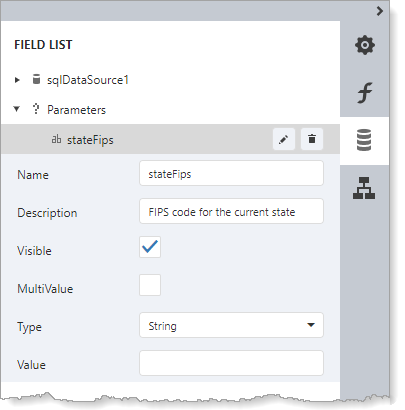
Subreport parameter configured to take a single FIPS code
-
-
Press Ctrl+S to save the report.
Saving a Master-Detail report that uses a subreport saves the entire report, regardless of whether you are in the master report or in the subreport when you save. You cannot save a subreport independently of the report that contains it.
Step 7: Add a Filter Condition to the Subreport's Query
-
In the Field List
, expand the data source (sqlDataSource1). -
Click
 Detailed Counties to show the management buttons.
 -
Click
to edit the query.The SQL Data Source Wizard opens.
-
Click Run Query Builder.
-
In the Query Properties panel, click the
 icon in the Filter box to open the Filter Editor.
 -
Add the condition to match the state's FIPS code:
-
Default Mode:
-
Hover the pointer to the right of the And operator to show the plus icon
 .
. -
Click the plus icon and select Add condition.
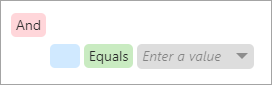
New condition, ready to be configured
-
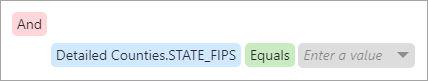
Click the blue box, expand the Detailed Counties layer, and select STATE_FIPS.
-
Click the arrow
 in the gray Enter a value box and select Parameter.
The box turns yellow and says Create new parameter.
-
Click the yellow box and select Create new parameter to create a new query parameter.
-
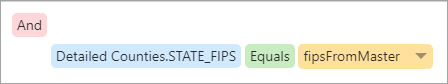
Type the following name for the parameter:
fipsFromMaster -
Click away from the condition.
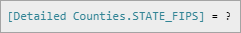
The filter expression looks like this in the default mode:
-
Select the Advanced Mode checkbox.
The expression looks like this in Advanced Mode:
The right-hand term should specify the query parameter that you just defined. This is a limitation of the Filter Editor.
-
Type the parameter name after the question mark.
The expression should look like this:
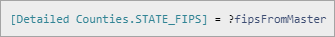
-
-
Advanced Mode:
-
Select the Advanced Mode checkbox.
-
Type or paste the following expression in the box:
[Detailed Counties.STATE_FIPS] = ?fipsFromMaster You can use the
==operator instead of the=operator:[Detailed Counties.STATE_FIPS] == ?fipsFromMaster
-
-
-
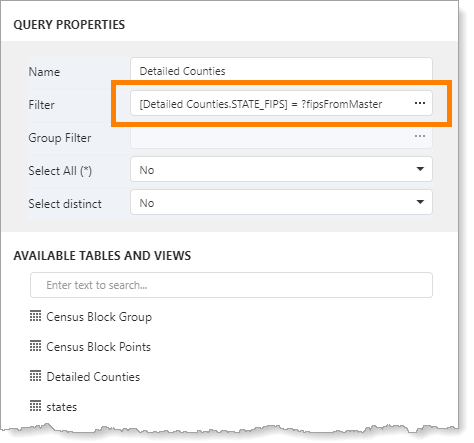
Click Save.
The filter expression appears in the Filter box in the Query Properties panel.
Do not attempt to preview the results yet. The filter expression includes a query parameter that does not yet have a value, so the query will fail.
-
Click OK to close the Query Builder.
-
Click Next.
-
Expand the FipsFromMaster query parameter to show the Name, Type, and Value.
-
Set Type to Expression.
-
Click the
icon in the Value box to open the Expression Editor. -
Expand
Parameters.These are the subreport parameters.
-
Double-click the stateFips parameter, shown at
 in the screen capture.
The Expression Editor will build the expression and display it, shown at
 . The expression is
 [Parameters.stateFips].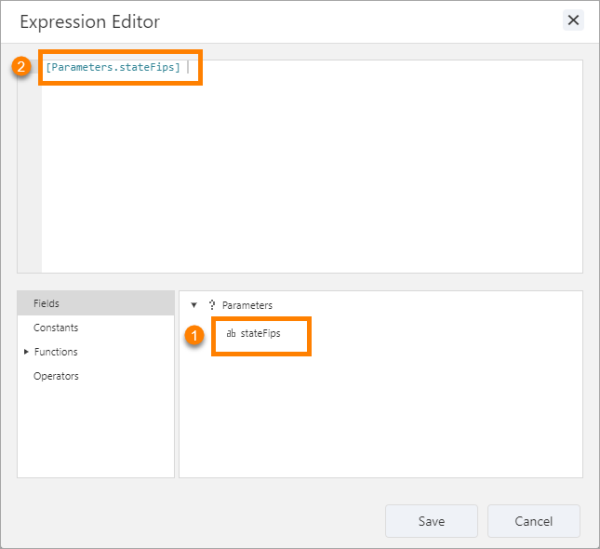
Expression that accesses the stateFips subreport parameter
-
Click Save.
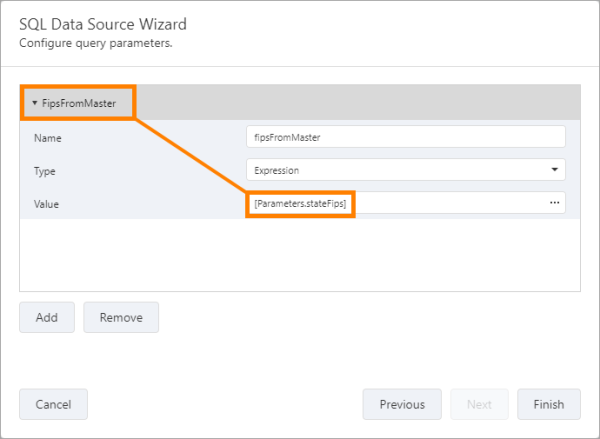
Association between query parameter fipsFromMaster and report parameter stateFips
-
Click Finish to close the SQL Data Source Wizard.
-
Press Ctrl+S to save the report.
Step 8: Design the Subreport
-
In the Field List, expand
Detailed Counties. -
Drag the fields from the Field List and drop them on the detail1 band.
To insert multiple fields at one time as a table, select the fields by holding down the Ctrl or Shift key when you select the fields, and then drag the selection to the design surface.
-
Add labels for the data fields:
-
Open the Properties panel, expand Actions and click Insert Group Header Band
 .
.The Group Header Band allows you to include labels that appear once for each time the subreport runs, in other words, once for each group of counties.
-
Add labels for the data fields to GroupHeaderBand1 and format them.
-
Reduce the height of GroupHeaderBand1.
-
-
Reduce the height of the detail1 band.
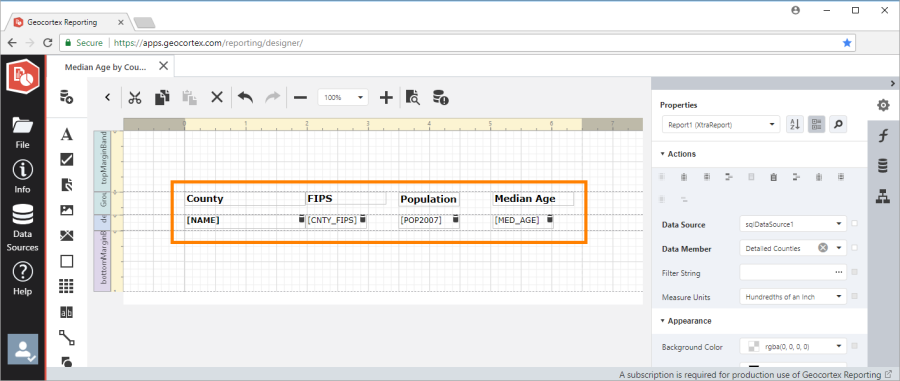
Formatted content in the subreport
-
Press Ctrl+S to save the report.
Step 9: Preview the Subreport
-
Click Preview
 .
.You are prompted to enter a state FIPS code.
-
Click in the stateFips box and type:
06 This is the FIPS code for California.
-
Click Run.
The subreport opens as a PDF in a separate browser tab.
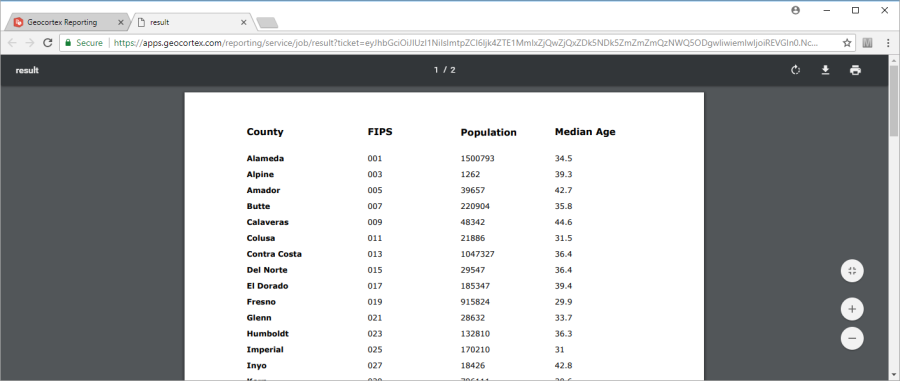
Subreport preview
Step 10: Return to the Master Report
-
In Report Designer, press Ctrl+Alt+Home or click the Navigate to parent report icon
.Report Designer shows the master report.
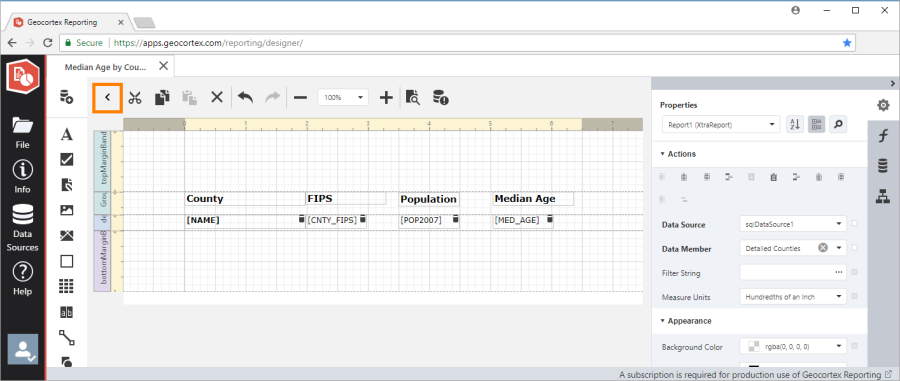
Location of icon to navigate to the master report
Step 11: Bind the Subreport Parameter
-
Select the subreport1 control on the design surface.
-
In the Properties panel, expand Data and then expand Parameter Bindings.
If you don't see a Parameter Bindings section within the Data section, make sure that you are in the master report and you have selected the subreport1 control on the design surface.
-
Click
to add a parameter binding. -
Select
stateFipsfrom the Parameter Name drop-down list. -
Open the Binding drop-down list, expand the sqlDataSource1, expand the states layer, and select STATE_FIPS.
The parameter binding's configuration means: The STATE_FIPS attribute in the states layer of the data source called sqlDataSource1is bound to the parameter called stateFips.
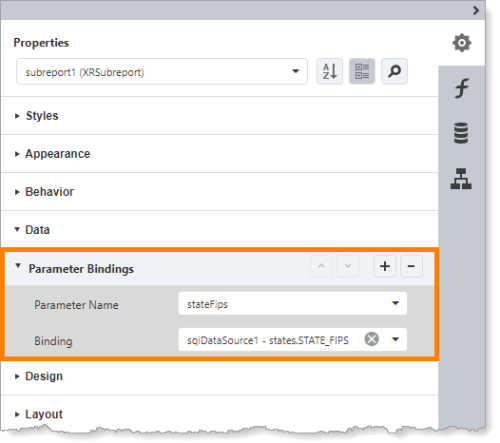
Field in the master report's data source bound to a subreport parameter
-
Save the report.
Step 12: Preview the Report
-
Click Preview
. -
Click Run.
The Master-Detail report opens as a PDF in a separate browser tab. The report includes data from two different ArcGIS map services, one (the master) for US states and the other for related data about the counties in each state.
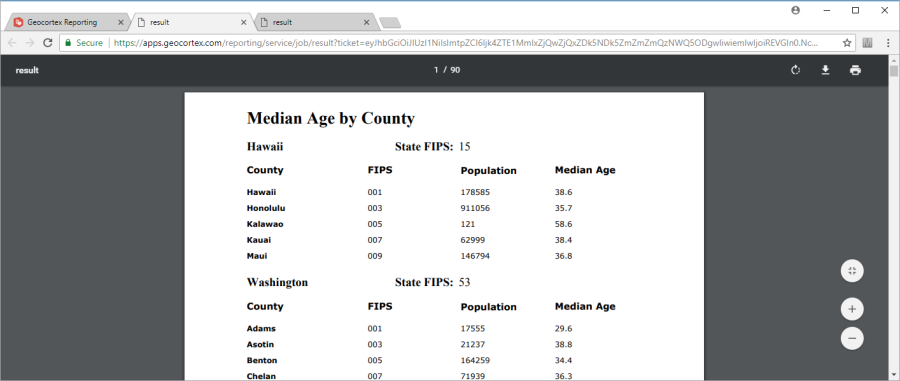
Master-Detail report preview