In this walkthrough, you will:
1.Query a feature layer using a workflow
2.Convert ArcGIS graphics to VertiGIS Studio features
3.Define a Highcharts configuration
4.Display the chart in a Chart component
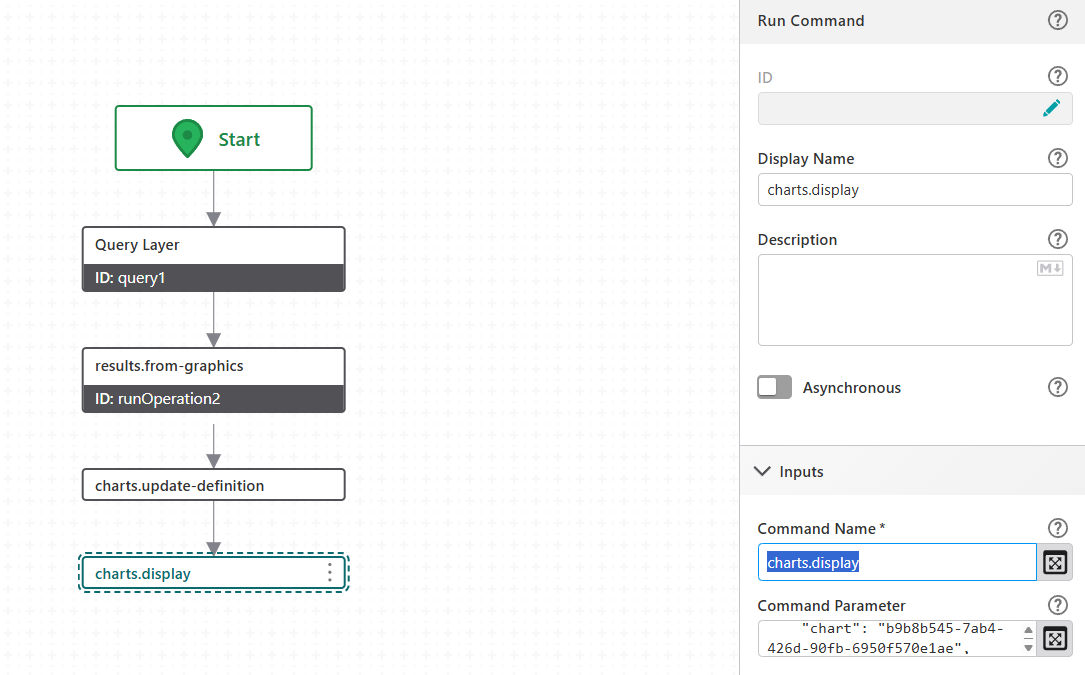
Two Run Command activities handle the chart: one to set the chart definition, and one to activate and populate it.
Prerequisites
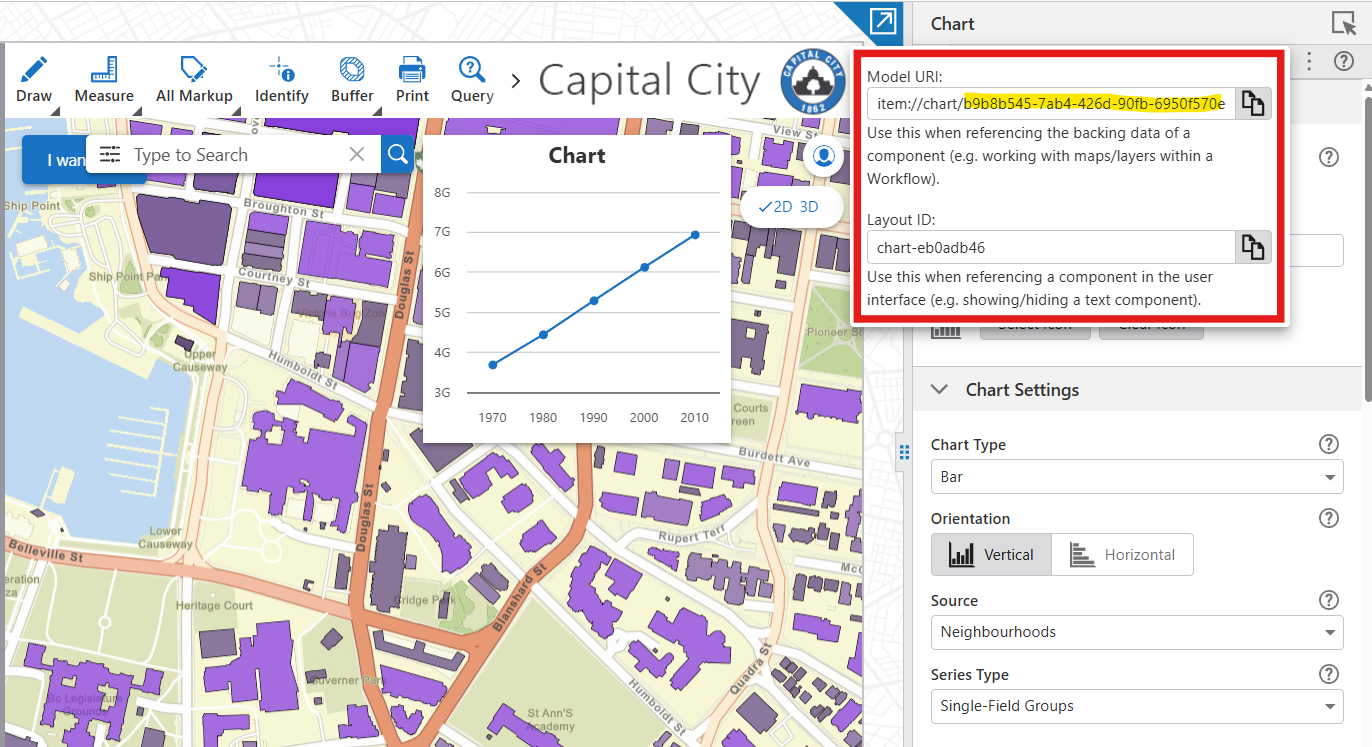
Add a Chart component to your app layout in VertiGIS Studio Web and note its component ID from the app JSON. You will need this ID when configuring the charts.display command.
Query the Feature Layer
1.Add a Query Layer activity after the Start activity.
2.Set URL to your feature layer endpoint. For this example:
https://services.arcgis.com/p3UBboyC0NH1uCie/ArcGIS/rest/services/CapitalCity_Web_2_0/FeatureServer/2
3.Set Where to 1=1 to return all features.
4.Set Out Fields to * to return all fields.
5.Enable Return Geometry.
Convert Graphics to Features
The chart commands expect VertiGIS Studio Features, not raw ArcGIS graphics. Use the results.from-graphics operation to convert them.
1.Add a Run Operation activity after the Query activity.
2.Set Operation Name to results.from-graphics.
3.Set Operation Parameter to:
={ "graphics": $query1.features }
Define the Chart
Use charts.update-definition to pass a Highcharts chart configuration to the Chart component. The definition object follows the standard Highcharts API.
1.Add a Run Command activity after the runOperation2 activity.
2.Set Command Name to charts.update-definition.
3.Set Command Parameter to:
={
"definition": {
"chart": {},
"title": {
"text": "Look at this beautiful chart!!"
},
"legend": {
"enabled": false
},
"tooltip": {
"headerFormat": "<span style='color:{point.color}'>●</span> {series.name}:<br/>",
"pointFormat": "<b>{point.name}</b>, <b>{point.y}</b><br/>"
},
"xAxis": {
"type": "category",
"title": {}
},
"yAxis": {
"type": "linear",
"title": {}
},
"plotOptions": {
"series": {
"point": {
"events": {
"mouseOver": "highlights.add-focus",
"mouseOut": "highlights.remove-focus"
}
}
}
},
"series": [
{
"type": "line",
"data": [[1, 1], [2, 0], [3, 2]]
}
],
"annotations": [
{
"labels": [
{
"point": { "x": 1, "y": 1, "xAxis": 0, "yAxis": 0 },
"text": "Label 1"
},
{
"point": { "x": 2, "y": 0, "xAxis": 0, "yAxis": 0 },
"text": "Label 2",
"backgroundColor": "white"
}
]
}
]
}
}
This example uses static data in series.data for simplicity.In a real workflow, you would typically construct series data dynamically from feature attributes returned by the query.
Display the Chart with Workflow Data
Use charts.display to update the Chart component with the queried features.
1.Add a Run Command activity after the charts.update-definition activity.
2.Set Command Name to charts.display.
3.Set Command Parameter to:
={
"chart": "your-chart-component-id",
"features": $runOperation2.result
}
Replace your-chart-component-id with the ID of your Chart component.
The chart field targets a specific chart component. Without it, the command updates all active charts. The features value comes from the results.from-graphics operation output. A chart will only be displayed once it has received features from all required feature sources configured in the component.