You can configure the Chart component to display data from layer fields or tables when the user performs an Identify, Search, or Workflow operation.
Charts only appear when the user performs an Identify, Search, or Workflow operation on visible layers or tables, as a set of results (VertiGIS Studio Features) is required to display charts.
If you use a workflow to generate data for your charts, you must ensure the feature set is complete for all aspects of the chart to work. Specifically, it must contain OBJECTID and geometry.
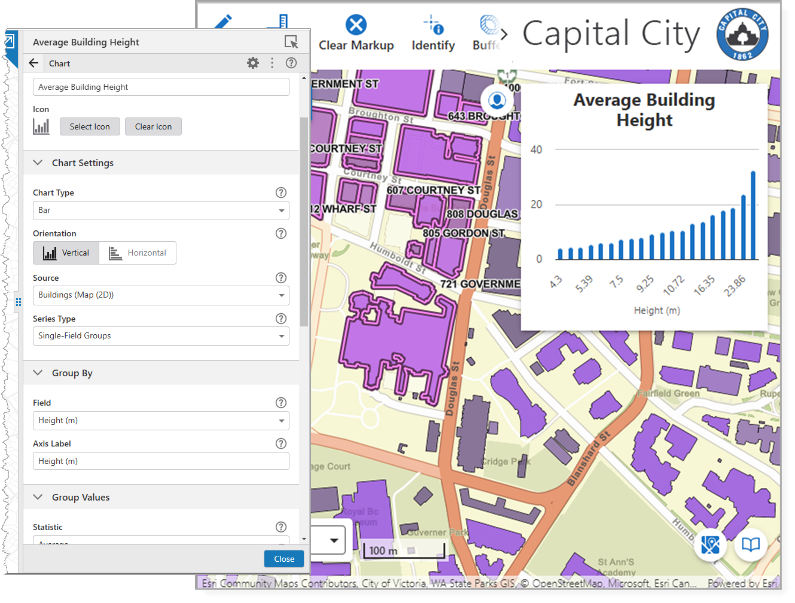
In the figure below, a bar chart is configured to show the average building height for the area selected via Identify.
Main Settings
Field |
Description |
|---|---|
Title |
Enter a title to display for the component. This title is used both in Web and Designer. |
Icon |
To select an icon to represent the component, click Select Icon, click the desired icon, and click OK. To remove the icon, click Clear Icon. |
Chart Settings
Field |
Description |
|---|---|
Chart Type |
Select the type of chart you want to display: •Bar: Displays values as proportional rectangular bars. •Pie: Displays the values as proportional slices of a circle. •Line: Displays values in a graph, each connected with a line. •Scatter Plot: Displays values in a graph, similar to a line chart but values are not connected with a line. |
Orientation |
Select the way to orient the graph. This option is not available for pie charts. •Vertical: Display the graph data parallel to the y-axis. •Horizontal: Display the graph data parallel to the x-axis. Setting the Orientation to Horizontal swaps the positions of the Axis Labels. |
Source |
Select the layer, table, or workflow from which to source the data for the chart. If the workflow executes the charts.display command with results from a layer or table on your map, set the chart Source to that layer or table, instead of the workflow. If you use the Query Layer activity in Workflow, we recommend you configure the layer extension from Web to the activity. Web can then map the results back to the original layer. |
Series Type |
Select the series type which determines how the chart presents the data: •Single-Field Groups: Displays the data grouped by a single field. For example, display the average height of buildings depending on their actual use. •Multi-Field Groups: Displays the data grouped by multiple fields. For example, display the average roughness and diameter of water lines. |
Group By
Field |
Description |
|---|---|
Field |
The layer field to use as the X values (when Orientation is set to Vertical). |
Is Date Field |
Specifies whether the field is a date field. This option only appears when Source is set to a workflow and Series Type is set to Single-Field Groups. |
Date Unit |
Specifies the part of the date to display. This option only appears when Field is a date field and Series Type is set to Single-Field Groups. The Hour option ignores all other aspects of the timestamp, including day, minutes, and seconds. Therefore, when displaying data for 10, all of the following would match: 10:00, 10:30, 10:59. |
Axis Label |
Specify a label for the X axis (when Orientation is set to Vertical). This option does not appear when Chart Type is set to Pie. |
Group Values
Field |
Description |
|---|---|
Statistic |
The function to apply to the Y values (when Orientation is set to Vertical): •Average: Returns the average of the Y values. •Sum: Returns the total of the Y values added together. •Maximum: Returns the highest Y value. •Minimum: Returns the lowest Y value. •Count: Returns the total number of Y values. |
Field |
The layer field to use as the Y values (when Orientation is set to Vertical). |
Multi-Field Groups |
Displays the data grouped by multiple fields. For example, display the average rainfall for January, February, March, and so on. When this option is selected, the fields must be numerical. |
Groups
Field |
Description |
|---|---|
Fields |
The layer fields to use as the X values (when Orientation is set to Vertical). |
Statistic |
The function to apply to the Y values (when Orientation is set to Vertical): •Average: Returns the average of the Y values. •Sum: Returns the total of the Y values added together. •Maximum: Returns the highest Y value. •Minimum: Returns the lowest Y value. |
X Axis Label |
Specify a label for the X axis (when Orientation is set to Vertical). This option does not appear when Chart Type is set to Pie. |
Y Axis Label |
Specify a label for the Y axis (when Orientation is set to Vertical). This option does not appear when Chart Type is set to Pie. |
XY Plot |
Plots the data as a series of X and Y values. For example, display the flow rate of fire hydrants depending on their installation date. This option only appears when the Chart Type is either Line or Scatter Plot. This option requires that both fields are either numbers or dates. |
X Value
Field |
Description |
|---|---|
Field |
The layer field to use as the X values (when Orientation is set to Vertical). |
Axis Label |
Specify a label for the X axis (when Orientation is set to Vertical). This option does not appear when Chart Type is set to Pie. |
Y Value
Field |
Description |
|---|---|
Field |
The layer field to use as the Y values (when Orientation is set to Vertical). |
Axis Label |
Specify a label for the Y axis (when Orientation is set to Vertical). This option does not appear when Chart Type is set to Pie. |
Advanced Settings
The Advanced Mode allows you to edit the code for both the Arcade script that generates the chart, as well as the Chart Definition JSON of the High Charts template that configures the appearance of the chart.
When you enable Advanced Mode, you lose access to Designer's UI to easily configure most chart settings.
Field |
Description |
|---|---|
Arcade Script |
To edit the raw Arcade Script used to transform results into chart data, click the Open Editor button. For more information, see ArcGIS Arcade. If changes are made to the script such that it no longer matches a Designer chart template, you will not be able to exit advanced mode. |
Chart Definition |
To edit the raw High Charts template JSON used to configure the appearance of the chart, click the Open Editor button. For more information, see Highcharts JS API Reference. If changes are made to the JSON configuration such that it no longer matches a Designer chart template, you will not be able to exit advanced mode. This includes specifying an unsupported chart type or adding more than one object in the series property. |
Events
Field |
Description |
|---|---|
Series Point Hover |
The command to execute when the user hovers the cursor over a series point on the chart. |
Series Point Hover End |
The command to execute when the user moves the cursor away from a series point on the chart. |
Series Point Click |
The command to execute when the user clicks a series point on the chart. |
Visibility Filters
Field |
Description |
|---|---|
Visible To |
Determines which users and groups can access this component. If no users or groups are specified, all users can access this component by default. The Hidden From setting overrides this setting. |
Hidden From |
Determines which users and groups are explicitly forbidden to access this component. This setting overrides the Visible To setting. |
Layout
Field |
Description |
|---|---|
Slot |
Select the slot to position the component within the Map component. In addition to the various positions on the map, such as Top Left and Bottom Center, you can position the component within the map context menu, which appears when the user right-clicks the map. You can also position the component within the Popup slot, which appears at the mouse cursor. This setting only appears when the component is within the Map component. |
Margin (px) |
The margin space around the component, measured in pixels. |
Initially Hidden |
Specifies whether or not the component is initially hidden when the app loads. If selected, the component remains hidden unless activated, for example, by the Show command. |