The Add Graphics activity allows you to add features to a graphics layer. If the features have symbols, they are displayed on the map.
If you want, you can specify the graphics layer to use. If you specify a layer that already exists, by default the activity aggregates the new features with any existing features in the layer. You can use this fact to accumulate features in a graphics layer. If you do not want to carry forward existing features, set the Remove All Features input to true. This clears the layer before adding the new features.
If you specify a layer that does not exist, the activity creates the layer. If you do not specify the layer, the activity uses the map's default graphics layer.
Example 1 - Display a Dynamically Created Feature
This example shows you how to use an Add Graphics activity to display a feature that is created at run-time. The workflow uses a Get Symbol From JSON activity to define the feature's symbol and a Geometry Picker form element to get the geometry from the user. The feature is created using a Create Feature activity. The layer specified in the Add Graphics activity does not exist, so the activity creates a new layer to add the features to.
Workflow Logic
The workflow has the following activities, in the order shown:
▪Get Symbol From JSON (symbol1): Define a fill symbol.
▪Display Form (form1): Display a form that uses a Geometry Picker element to get a geometry from the user.
▪Create Feature (feature1): Create the feature using the symbol and geometry.
▪Add Graphics: Create the specified graphics layer, add the feature to the layer, and display the symbol on the map.
To use the Add Graphics activity to show a dynamically created feature on the map:
1.Open Workflow Designer.
2.In a new, blank workflow, add the following activities and connect them in the given order:
▪Get Symbol From JSON (symbol1)
▪Display Form (form1)
▪Create Feature (feature1)
▪Add Graphics
3.Get Symbol From JSON (symbol1): Set the Json input to:
{
"type": "esriSFS",
"style": "esriSFSSolid",
"color": [0,255,0,100],
"outline":
{
"style" : "esriSLSSolid",
"color": [0,255,255,200],
"width": 2
}
}
This symbol has an aqua outline and green fill.
4.Display Form (form1):
▪Double-click the Display Form activity to edit it.
▪Add a Geometry Picker form element. Use the Geometry Picker's default configuration.
▪Click Start in the breadcrumbs to return to the main workflow.
5.Create Feature: Configure the inputs as follows:
▪Geometry: =$form1.state.geometryPicker1.value.geometry[0]
▪Symbol: =$symbol1.symbol
6.Add Graphics: Configure the inputs as follows:
▪Layer Id: userFeature
Specify an ID for the graphics layer. Use an ID that is not likely to exist in the map, so the Add Graphics activity creates a new layer. For example, you could enter userFeature or 123456789.
▪Features: =$feature1.feature
This specifies the feature created by the Create Feature activity.
7.Run the workflow in the Sandbox using the 2D Map (ArcGIS API v3.x) environment.
The workflow displays the geometry entered by the user using a fill symbol.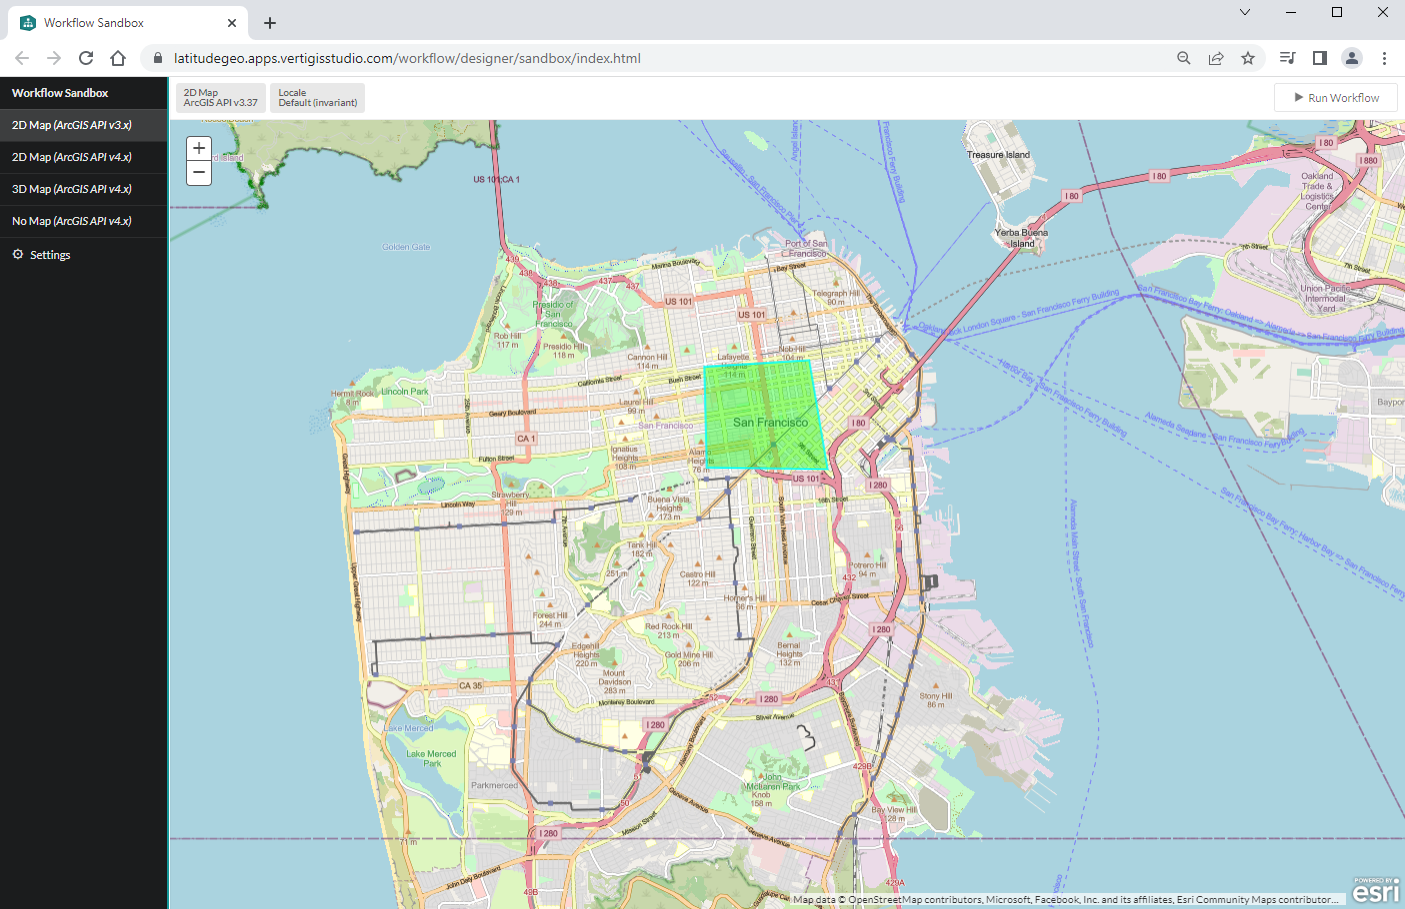
8.Press Ctrl+S to save the workflow.
Example 2 - Display Query Results
This example shows you how to use an Add Graphics activity to display the features returned by a Query Layer activity. The query returns four US states. The workflow zooms the map to the returned states, assigns a fill symbol to each feature, and then uses the Add Graphics activity to show the features on the map. This example specifies a graphics layer that does not exist, so the activity creates a new layer to add the features to.
Workflow Logic
The workflow has the following activities, in the order shown:
▪Query Layer (query1): Query an ArcGIS layer for US states in a particular region.
▪Set Map Extent: Zoom to the features returned by the query. This ensures that the map is positioned to show the returned states.
▪Get Symbol From JSON (symbol1): Define a fill symbol.
▪For Each (forEach1): Assign the symbol to each feature returned by the query.
The For Each subworkflow has the following activity:
•Set Feature Symbol: Assign the symbol to the current feature.
▪Add Graphics: Create the specified graphics layer, add the feature to the layer, and display the symbol for each feature on the map.
To use the Add Graphics activity to show query results on the map:
1.Open Workflow Designer.
2.In a new, blank workflow, add the following activities and connect them in the given order:
▪Query Layer (query1)
▪Set Map Extent
▪Get Symbol From JSON (symbol1)
▪For Each (forEach1)
▪Add Graphics
3.Query Layer (query1): Configure the inputs:
▪Url: https://sampleserver6.arcgisonline.com/arcgis/rest/services/Census/MapServer/3
This is the URL for a layer of US states.
▪Where: SUB_REGION='West South Central'
▪Return Geometry: true
▪Output Spatial Reference: 102100
▪Output Fields: *
4.Set Map Extent: Set the Features input to: =$query1.features
5.Get Symbol From JSON (symbol1): Set the Json input to:
{
"type": "esriSFS",
"style": "esriSFSSolid",
"color": [255,255,0,255],
"outline":
{
"style" : "esriSLSSolid",
"color": [255,165,0,255],
"width": 2
}
}
This symbol has an orange outline and yellow fill.
6.For Each:
▪Set the Items input to: =$query1.features
▪Double-click the For Each activity to open its subworkflow.
▪Add a Set Feature Symbol activity, connect it to the For Each block, and configure the inputs as follows:
▪Feature: =$forEach1.item
▪Symbol: =$symbol1.symbol
▪Click Start in the breadcrumbs to return to the main workflow.
7.Add Graphics: Configure the inputs as follows:
▪Layer Id: 999
Alternatively, you can specify the Layer ID as a string: ="999"
Specify an ID for the graphics layer. Use an ID that is not likely to exist in the map, so the Add Graphics activity creates a new layer. For example, you could enter ="999" or myGraphicsLayer.
▪Features: =$query1.features
This specifies the features returned by the query.
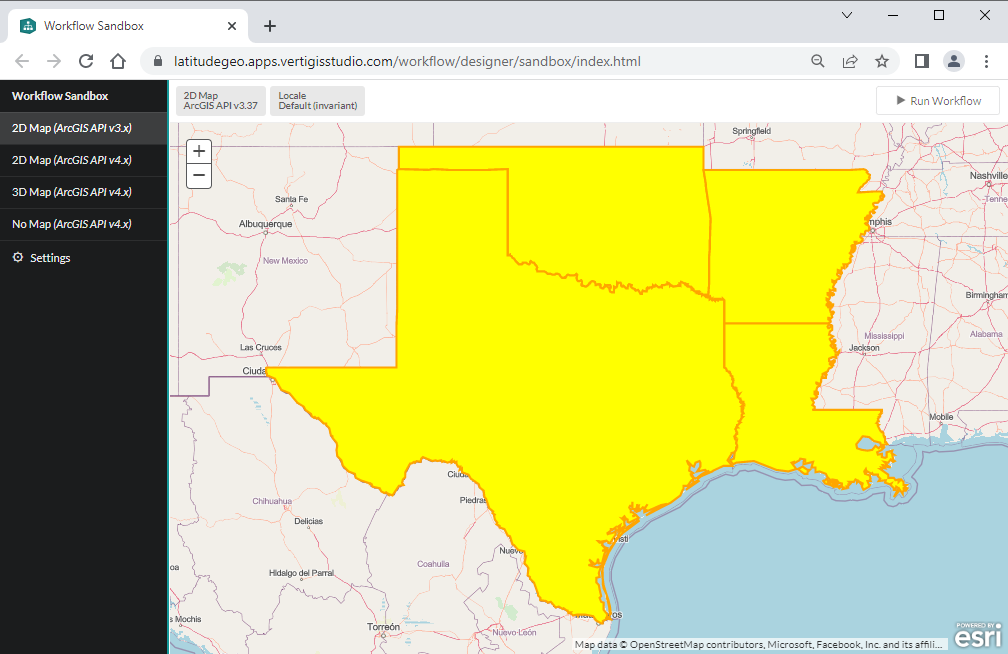
8.Run the workflow in the Sandbox. Do not use the No Map environment.
The map zooms to the states returned by the query and displays the symbols.
9.Press Ctrl+S to save the workflow.