Add a New Monitor
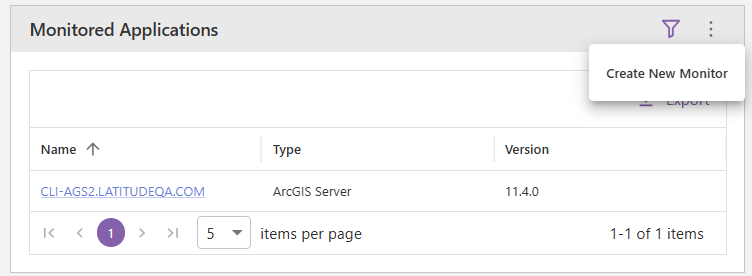
You can add monitors from Reports using the panel menu, if available.
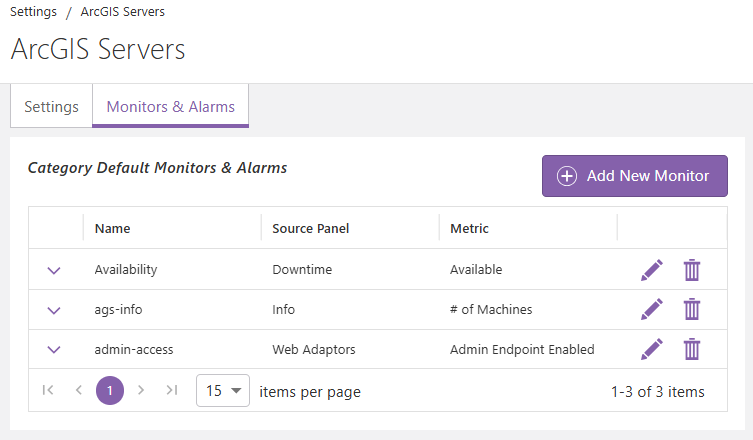
You can also add a new monitor in Settings on the Monitors & Alarms tab for both resource groups and individual resources.
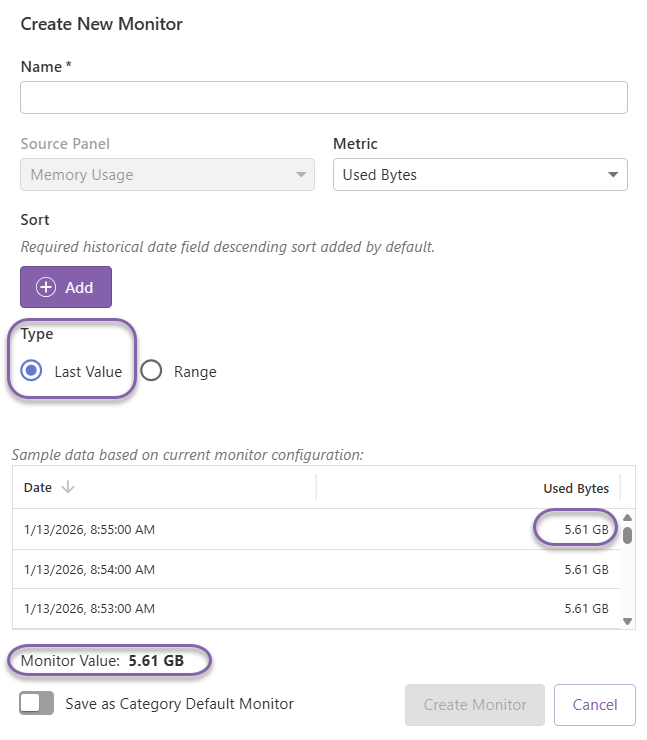
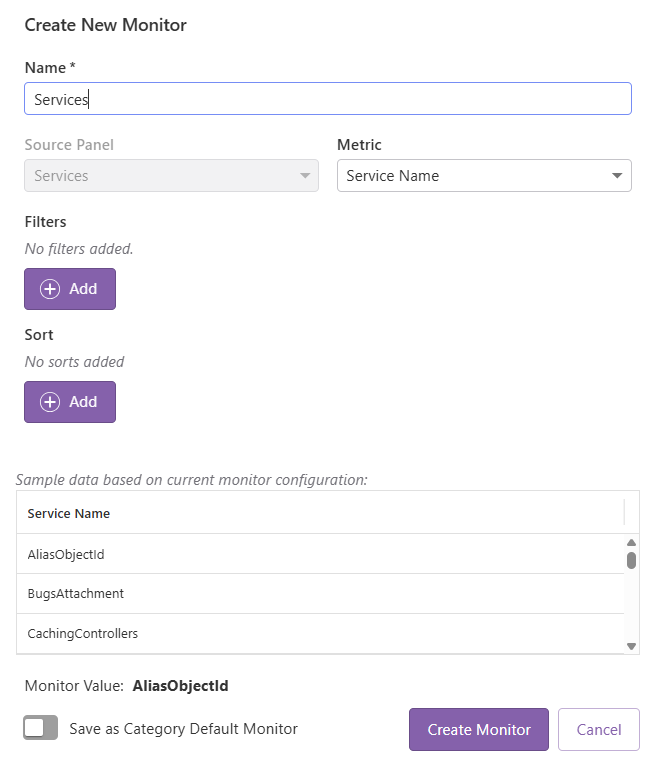
When adding a new monitor, a dialog appears that will have various options depending on the Source Panel and Metric you are creating the monitor for.
When adding a new monitor for an individual resource, the dialog will display the value the monitor would have given the current configuration in the dialog and may also display a sample data table, depending on the source panel, that reflects the values being used to build the monitor if data is available. This helps visualize the configuration for the monitor. The table always contains 20 rows and is ordered so that the first row will have the value that will be used by "Last Value" Range Type for the monitor.
If you opened the Create New Monitor dialog from a resource group page to add a new Category Default Monitor you will not see a current value or table with current data. Because of this limitation, for complex monitors, we recommend creating the monitor from an individual resource that has some data to visualize the configuration and use the "Save as Category Default" toggle when saving.
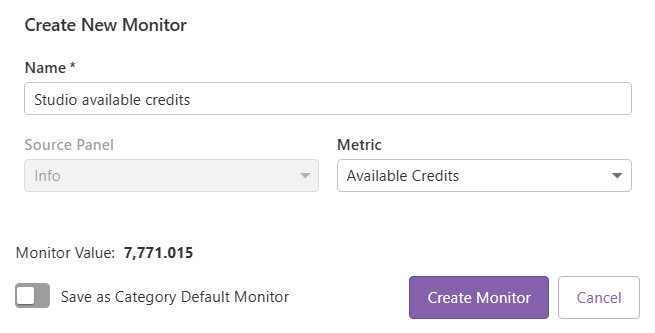
Basic status information will only allow you to select the Metric.
Source panels that exist in Status may allow you to configure filters and sorting depending on the types of fields available.
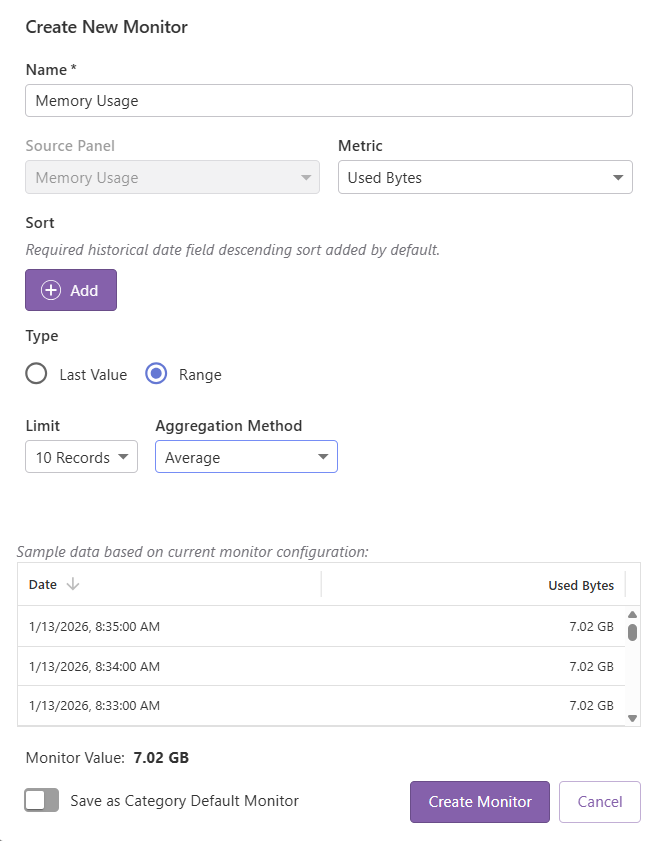
Source panels that exist in Trends may allow you to configure filters and sorting as well as if the final monitor value should be the most recent value for the metric or an aggregation over a specific number of records.
To configure a monitor that tracks when a specific server is unavailable:
1.While on the Monitors & Alarms tab in Settings for the specific server, click the add monitor button. This will open the "Create New Monitor" dialog.
2.Select Availability as the Source Panel.
3.Select Available as the Metric.
4.Click Add under Filters.
5.Configure the filter by selecting End Date as the field and Empty as the operator.
Optional: Toggle on Save as Category Default Monitor if you would like all configured servers to have this monitor.
6.Click Create Monitor.
If you would like to learn how to add alarms to this monitor, see the To configure an alarm that triggers when a specific server is unavailable section in Add a New Alarm.
Edit a Monitor
To edit a monitor, click the edit icon (![]() ) in the same row as the monitor. The Edit Monitor dialog will appear where you can rename the monitor and change other settings as needed. Click Save Changes to save the changes made to the monitor. The monitor will reevaluate its current value when it is changed.
) in the same row as the monitor. The Edit Monitor dialog will appear where you can rename the monitor and change other settings as needed. Click Save Changes to save the changes made to the monitor. The monitor will reevaluate its current value when it is changed.
You cannot change the Source Panel or Metric of an existing monitor.
If the monitor is for an individual resource that is inherited from the category default monitors you cannot edit the monitor for the individual resource. Instead, edit the category default monitor, or create a new monitor for the individual resource.
Remove a Monitor
To remove a monitor, click the delete icon (![]() ) in the same row as the monitor. A dialog will appear asking if you're sure you want to remove the monitor, click Delete to remove the monitor, or Cancel to leave the monitor as configured.
) in the same row as the monitor. A dialog will appear asking if you're sure you want to remove the monitor, click Delete to remove the monitor, or Cancel to leave the monitor as configured.
If the monitor is for an individual resource that is inherited from the category default monitors, you cannot remove the monitor.
The historical record of the monitor + alarm is maintained when the monitor is removed, allowing you to view the historical information related to alarms on the removed monitor in Reports.