Monitor values and alarm states are displayed in Reports at the resource-specific level. Alarm states can also be viewed at the overview level.
There are three possible alarm states shown in Reports if alarms have been configured on monitors:
•![]() Info
Info
•![]() Warning
Warning
•![]() Error
Error
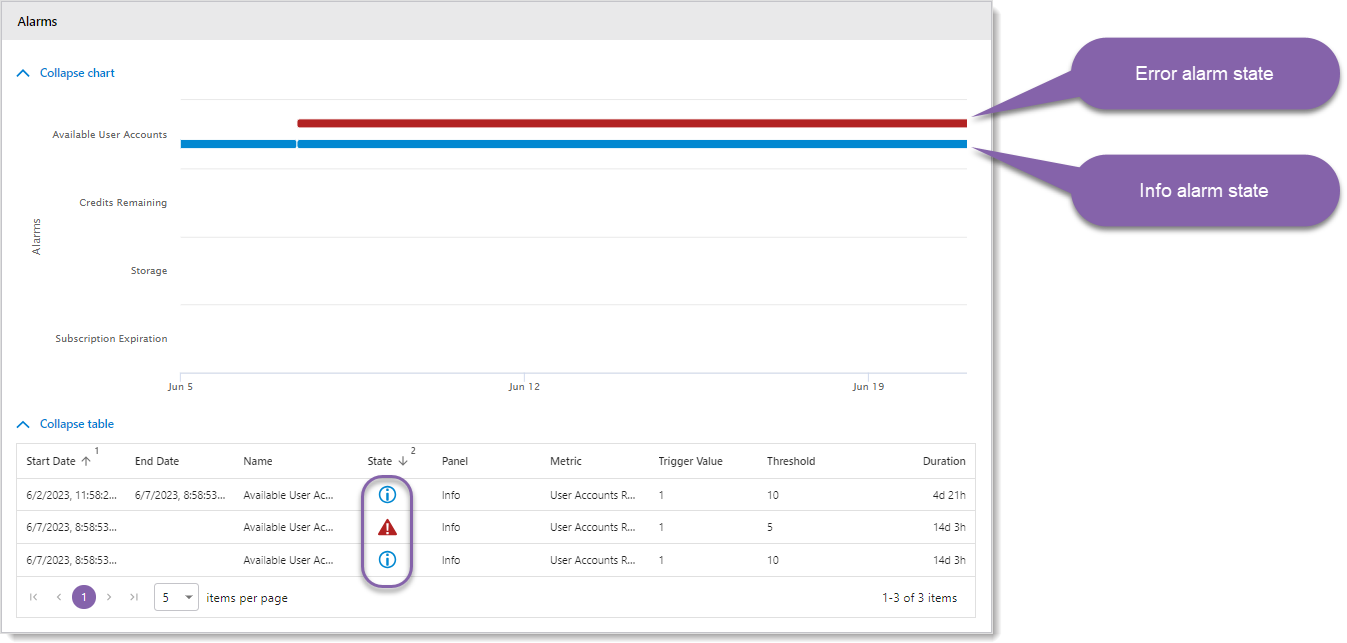
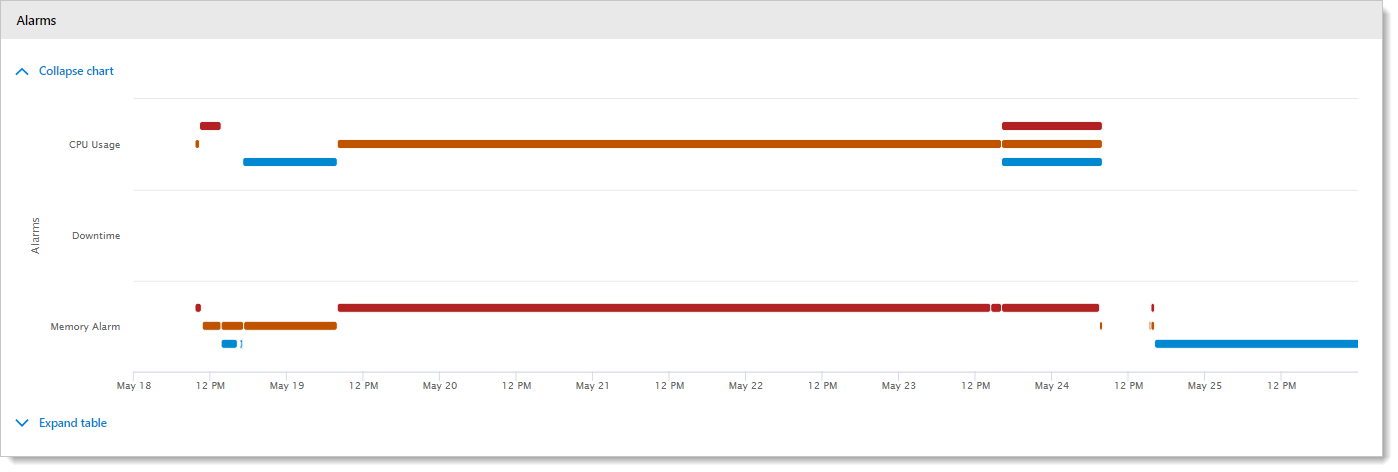
In the Resource Detail Reports > Trends tab, the alarm trend data is shown as blue, orange, and red lines on the charts.
There are also some other auxiliary states:
•![]() No alarms have been set
No alarms have been set
•![]() No alarm has been triggered
No alarm has been triggered
• ![]() Pending data evaluation
Pending data evaluation
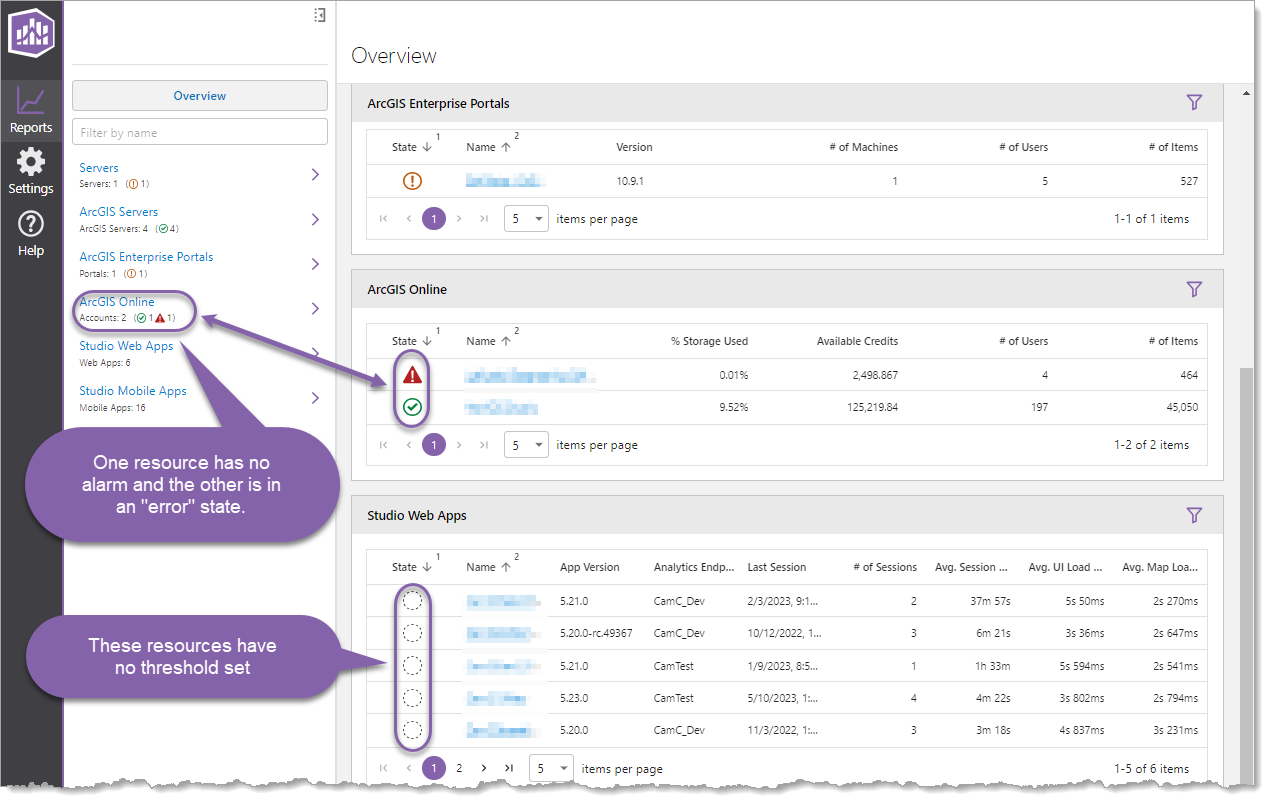
When viewing Overview Reports, alarm states can be seen in two places: Navigation Section and for each resource in the various resource group panels.
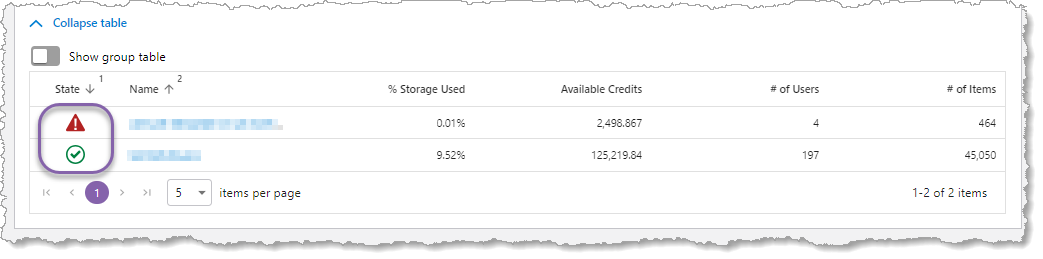
When viewing Resource Overview Reports, alarm states can be seen in the Status tab > table.
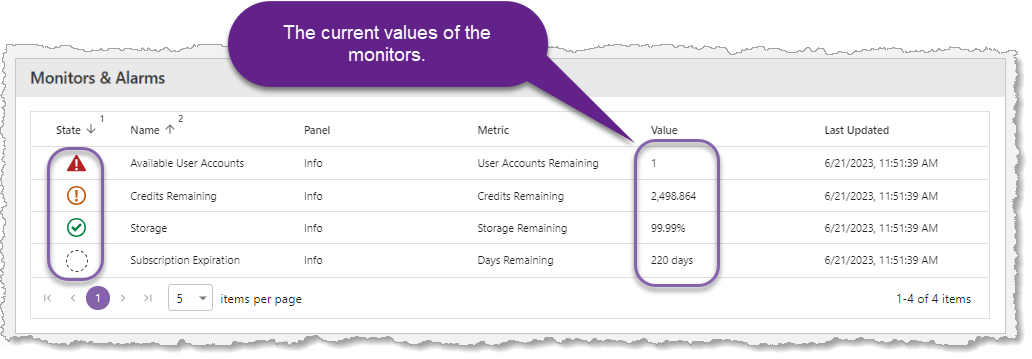
When viewing Resource Detail Reports, alarm states can be seen in the Status tab > Monitors & Alarms panel. In the following example, the Available User Accounts has an Error state because the number of available users is below the threshold. The Credits Remaining is in a Warning state because the credits remaining met that threshold, but not low enough to reach a Error state. The Storage metrics show that at lease one alarm has been created, but a setpoint has not been breached. The Subscription Expiration does not have an alarm set.
Historical data of alarms states can be seen in the Trends tab > Alarms panel.