Alarm states are displayed in Reports, both at the overview level and resource-specific level.
There are three possible alarm states shown in Reports:
•![]() Info
Info
•![]() Warning
Warning
•![]() Error
Error
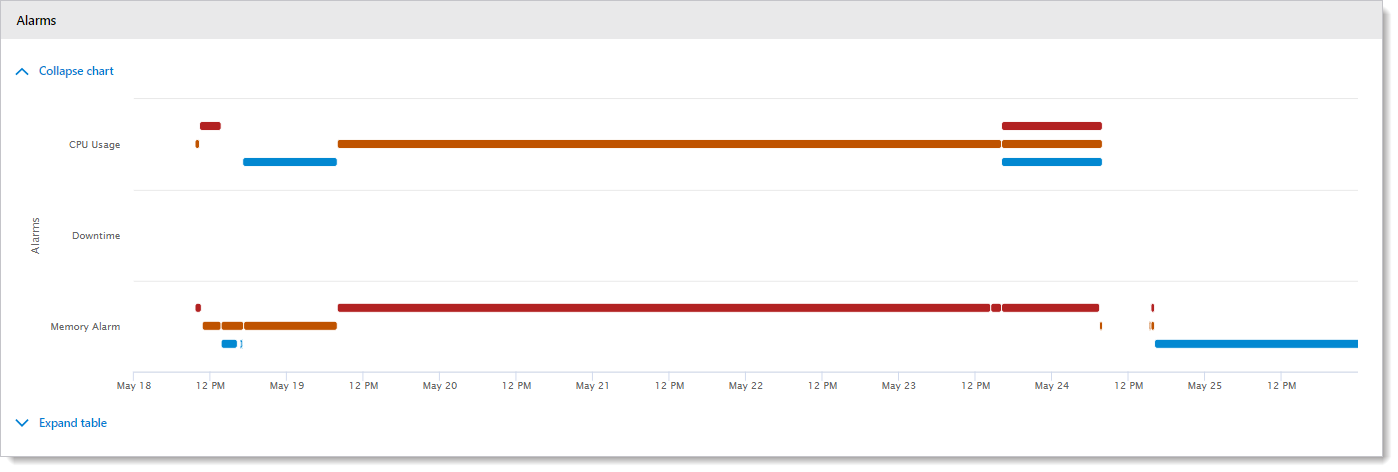
In Resource Detail Reports > Trends tab, the alarm trend data is shown as blue, orange, and red lines on the charts.
There are two auxiliary states shown in Reports:
•![]() No threshold has been set
No threshold has been set
•![]() No alarm has been triggered
No alarm has been triggered
When viewing Overview Reports, alarm states can be seen in two places: Navigation Section and for each resource in the various resource group panels.
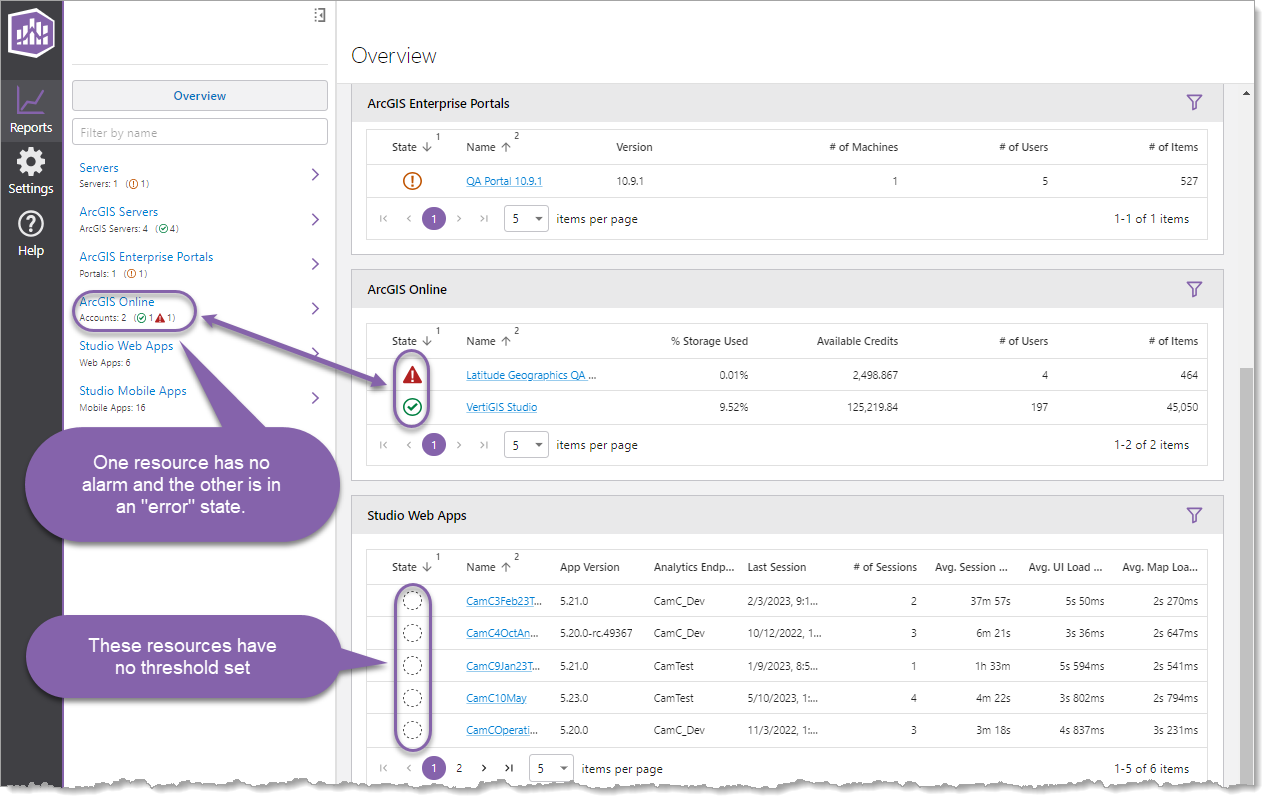
If you see an alarm state with no threshold set, you should configure an alarm for that resource group or for that specific resource.
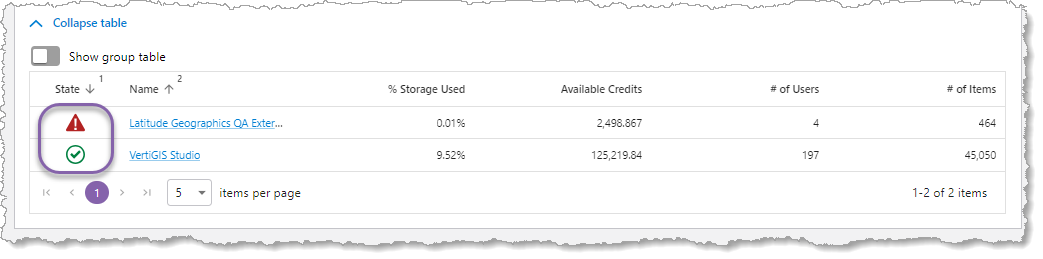
When viewing Resource Overview Reports, alarm states can be seen in the Status tab > table.
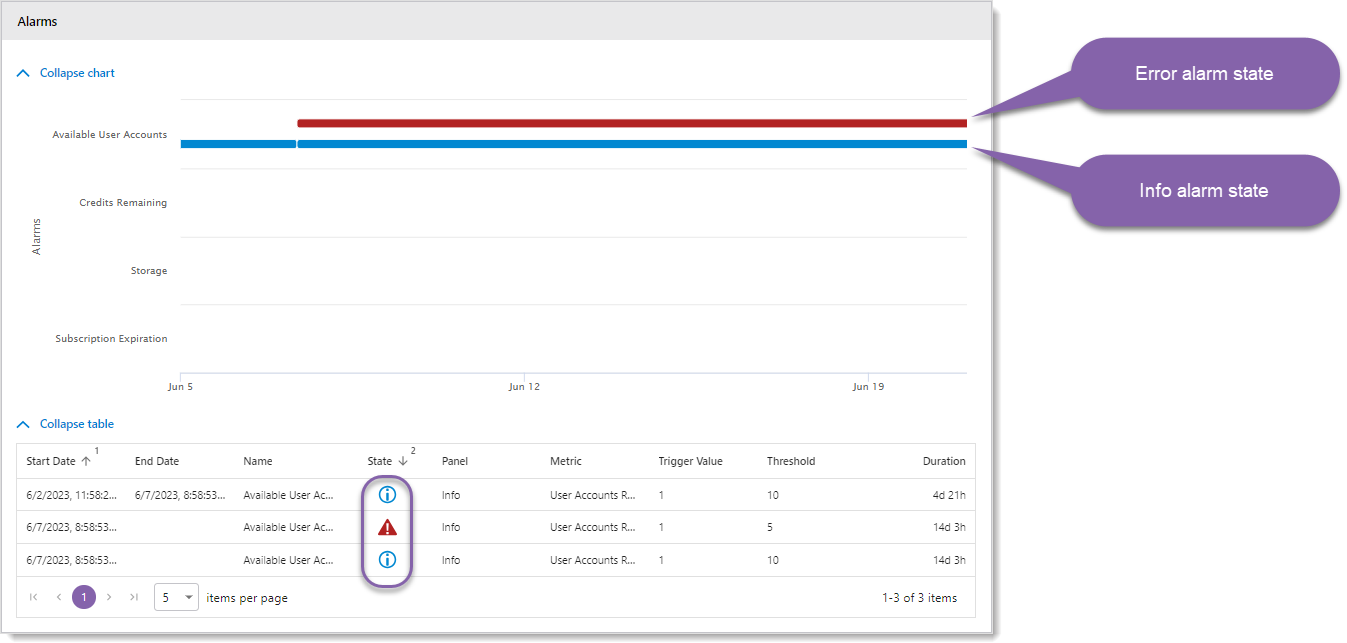
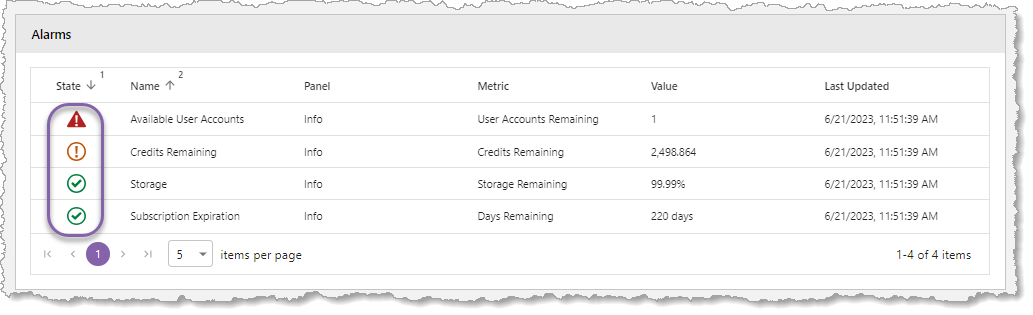
When viewing Resource Detail Reports, alarm states can be seen in the Status tab > Alarms panel. In the following example, the Available User Accounts has an Error state because the number of available users is below the threshold. The Credits Remaining is in a Warning state because the credits remaining met that threshold, but not low enough to reach a Error state. The Storage and Subscription Expiration metrics show that at lease one alarm has been created, but a setpoint has not been breached.
Historical data of alarms states can be seen in the Trends tab > Alarms panel.