Charting Module
The Charting Module implements the ability to display charts of a feature layer's data in HTML5 viewers. The data can be from the layer's fields or from a data link that is configured for the layer.
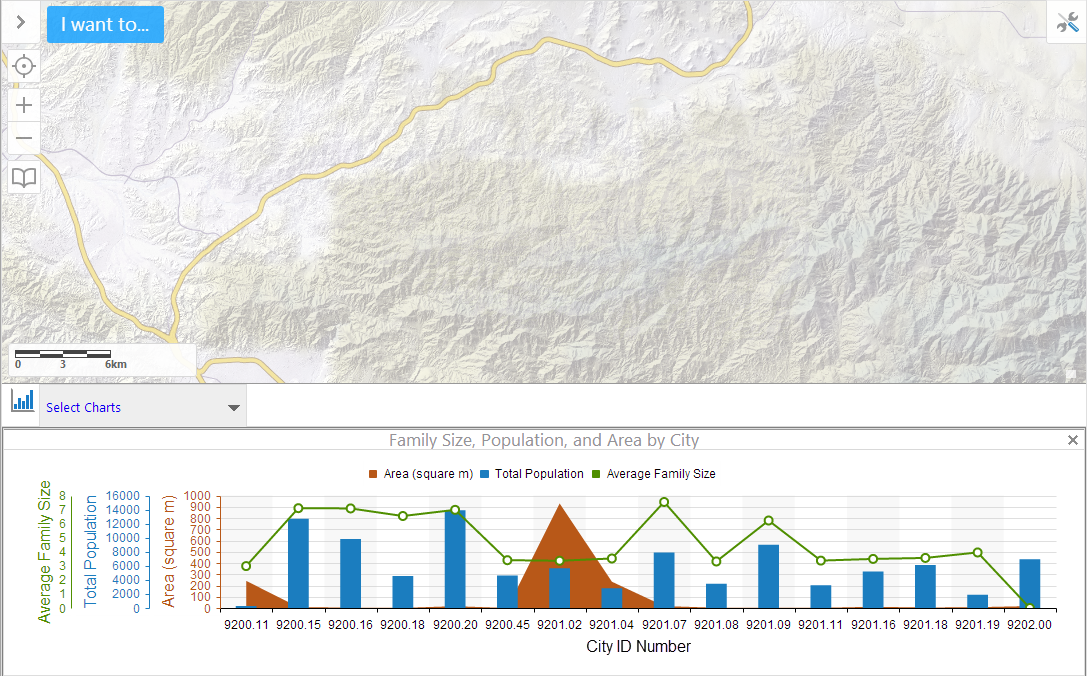
Chart example
Charts are configured in Manager. For more information on how to configure charts, see Charting.
It is also possible to display charts for a single feature. For more information, see FeatureDetails Module.
Configuration Properties
The Charting Module requires the Charting library as well as the Mapping.Charting library.
Module
-
infrastructureLibraryId: The ID of the infrastructure library. By default, this isCharting. -
adapters: An array of chart point adapters. Chart point adapters have the following properties:-
type: The fully-qualified type of the chart point adapter. For example,geocortex.essentialsHtmlViewer.mapping.modules.charting.FeatureChartPointAdapterorgeocortex.essentialsHtmlViewer.mapping.modules.charting.DataLinkChartPointAdapter. -
source: The source of the chart data. For example,FieldorDataLink. -
configuration: An object containing chart point adapter configuration. By default, this is empty.
-
-
behaviors: An array of named behaviors that run when an associated event occurs. By default, the behaviors are:-
ChartPointMouseHoverBeginBehavior: A behavior that runs an array of commands when the user hovers the mouse over a chart point. By default, this includes two commands:ClearChartHighlightsandHighlightChartFeatureSet. -
ChartPointMouseHoverEndBehavior: A behavior that runs an array of commands when the user stops hovering the mouse over a chart point. By default, this includes theClearChartHighlightscommand. -
ChartPointMouseDownBehavior: A behavior that runs an array of commands when the user clicks a chart point. By default, this includes two commands:ShowMapandRunChartFeatureActions.
You can remove or rearrange the commands of any behavior. You can also remove behaviors altogether.
You can add commands to a behavior if the command does not require a parameter, or if the type of the command's parameter matches the parameter of an existing command or the event associated with the behavior. Refer to "Viewer Commands and Events" in Developer Help to determine if the parameters are compatible. Note that private commands and events are not documented.
Adding a new behavior is only recommended for experienced developers.
See Viewer Commands and Events for more information.
-
Views
-
ChartingView: Noconfigurationproperties
View Models
-
ChartingViewModel:-
mobileMode: When set totrue, the user can only select one chart at a time in the Handheld interface. The default isfalse. This setting does not affect the Desktop and Tablet interfaces. -
chartingEnabled: To enable charting, set totrue. The default istrue. -
chartConfiguration: A chart configuration object with the following properties:-
animationsEnabled: To enable chart animations, set totrue. In the Desktop and Tablet interfaces, the default istrue. In the Handheld interface, the default isfalse. -
gradientsEnabled: To enable chart gradients, set totrue. The default isfalse. -
interactiveLegendEnabled: To enable interactivity with legend items, set totrue. The default isfalse. When enabled, clicking legend items of pie charts will enable or disable slices of the pie, and clicking legend items of linear charts will toggle the display of corresponding series. -
pieStartAngle: The angle at which to start pie charts in degrees. The default is180. -
renderAs: The format in which to render charts. The default issvg. Possible values include:-
svgrenders the chart as an inline SVG document, if available. -
vmlrenders the chart as VML, if available. -
canvasrenders the chart as a Canvas element, if available.
-
-
chartWidth: The width of charts in pixels. The default is450. -
chartHeight: The height of charts in pixels. The default is220.
-
-
infrastructureLibraryId: The ID of the infrastructure library. By default, this isCharting. -
containerRegionName: The name of the container region in which to host charts. The default isChartingRegion. -
containerRegionType: The type of the container region in which to host charts. The default isgeocortex.framework.ui.DivStackRegionAdapter. -
showXButton: To display a button to close charts, set totrue. The default istrue. -
defaultViewIcon: The path to an the default charting view icon. The default isResources/Images/Icons/Toolbar/search-24.png. -
headerIsVisible: To display the charting header, set totrue. The default istrue. -
showHeaderForStandaloneViews: To display the charting headers for standalone views, set totrue. The default isfalse. -
backButtonOnRootView: To display a back button on the root view, set totrue. The default isfalse. -
showBackButtonAsX: To display the back button as an X, set totrue. The default istrue. -
showMaximizeButton: To display a maximize button for the container, set totrue. The default istrue. -
showHostedViews: To display views hosted in this view model, set totrue. The default isfalse. -
resizeY: To allow the container to be vertically resized, set totrue. The default istrue. -
ordering: A mapping of views and their order ranking, starting with0. A view with the rank of0is the root view of a particular view container. By default, this is empty.
-
Example - Add a Command with a Parameter to a Behavior
The following example demonstrates adding a new command with a parameter to the behavior, ChartPointMouseHoverBeginBehavior.
To add a command with a parameter to a behavior:
-
Run an XML editor or text editor as an administrator.
-
Open one of the viewer configuration files,
Desktop.json.js,Tablet.json.js, orHandheld.json.js, in the editor.By default, the configuration files are here:
C:\Program Files (x86)\Latitude Geographics\Geocortex Essentials\[instance]\REST Elements\Sites\[site]\Viewers\[viewer]\VirtualDirectory\Resources\Config\Default\
-
In the
Chartingmodule section, find thebehaviorsproperty. Locate the behavior you want to edit, for example,ChartPointMouseHoverBeginBehavior.{ "moduleName": "Charting", ... "configuration": { ... "behaviors": [ { "name": "ChartPointMouseHoverBeginBehavior", "event": "ChartPointMouseHoverBeginEvent", "commands": [ "ClearChartHighlights", "HighlightChartFeatureSet" ] }, ... ] }, ... }The behavior executes two commands:
ClearChartHighlightsandHighlightChartFeatureSet. -
Refer to Viewer Commands and Events to determine the type of parameter that is associated with these commands. While
ClearChartHighlightsdoes not have any parameter, HighlightChartFeatureSet has a parameter of typegeocortex.essentialsHtmlViewer.mapping.infrastructure.FeatureSet. -
Find a command that you want to add to the behavior that has the same parameter type. For example,
ZoomToFeatures. -
Add the desired command to the list of commands, separated by a comma. For example:
"commands": [ "ClearChartHighlights", "HighlightChartFeatureSet", "ZoomToFeatures" ] -
Save the file.