Description
Allows you to embed graphical gauges into your report.
Properties Common to Most Controls
For more information about the properties listed below, see Properties Common to Most Controls.
▪Actions: Align to Grid, Size to Grid, Center Horizontally, Center Vertically, Bring to Front, Send to Back, Fit Bounds to Container
▪>Styles: Even Style, Odd Style, Style
▪>Appearance: Background Color, Border Color, Border Dash Style, Border Width, Borders, Font Name, Font Size, Font Unit, Font Effects, Foreground Color, Padding
▪>Behavior: Can Publish, Keep Together, Visible
▪>Data: Tag
▪>Design: Name
▪>Layout: Location, Size
▪>Navigation: Bookmark, Parent Bookmark, Navigation URL
For more information regarding each of the property groups, see the Control Reference.
Actions
View Type |
Specifies the type of gauge displayed. The following options are available: ▪Circular: Gauge is displayed in a circular format. ▪Linear: Gauge is displayed as a straight line. |
View Style |
Specifies how the gauge is oriented, given the selected View Type. |
View Theme |
Specifies the color theme of the gauge. |
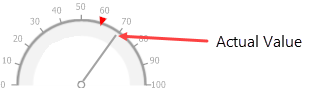
Actual Value |
Specifies the value displayed by a gauge.
|
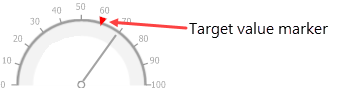
Target Value |
Specifies the position of the target value marker
|
Minimum |
Specifies the gauge's minimum value. |
Maximum |
Specifies the gauge's maximum value. |
Appearance
Image Type |
Specifies how the image is rendered. Options for this property include the following: ▪Metafile: The quality of the rendered image is always good, but in particular cases, some details of the control can be lost. This is the default. ▪Bitmap: The quality of the rendered image is sometimes poor, but it allows the control to be drawn more precisely. |
View Style |
Specifies how the gauge is oriented, given the selected View Type. |
View Theme |
Specifies the color theme of the gauge. |
View Type |
Specifies the type of gauge displayed. The following options are available: ▪Circular: Gauge is displayed in a circular format. ▪Linear: Gauge is displayed as a straight line. |
Data
Actual Value |
Specifies the value displayed by a gauge.
|
Tickmark Count |
Specifies the number of tick marks displayed on a gauge scale. |
Maximum |
Specifies the gauge's maximum value. |
Minimum |
Specifies the gauge's minimum value. |
Target Value |
Specifies the position of the target value marker
|
Related Tutorials
Refer to the following resources for additional help on implementing this control: