Work with Charts
The following sections describe how to work with charts in the VertiGIS Inline Designer:
Advanced Configuration
Some of the configuration settings described below provide an Advanced option. Enabling this allows you to configure a function that sets the option at runtime, when the view is loaded in an application. Functions are not discussed in the following sections. For details, see Advanced Configuration.
If you configure style rules, these will override any advanced functions configured to set the display of the chart.
Add and Configure a Chart
-
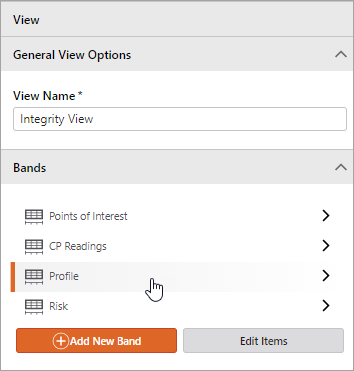
In the View panel, in the Bands section, click the band to which you want to add a chart.
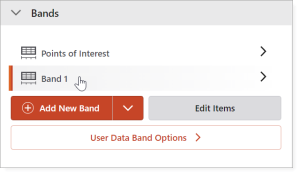
The Band Options panel opens.
-
On the Band Options panel, in the Charts section, click Add Chart to Band.
- or -
In the main workspace area, click the Add Chart to Band button that displays beneath the band.
The Chart Options panel opens.
-
Configure chart options as described below:
General Chart Options
These options set the basic properties of the chart.
The ID field is not editable. This value is automatically assigned and used internally to identify the chart - for example, it will display in any browser console error messages. You may use this field in advanced functions, if required (see Advanced Configuration).
-
Chart Name: Sets the name for the chart. This name appears in the list of chart names in the band configuration.
-
Data Source:
-
Select a data source from the drop-down list.
- or -
-
Click Add New Data Source to add a new data source. For details on configuring data source options, see Configure Data Source Options.
-
-
If your data does not have Y values, you can choose one of the following options:
-
Y Value: Assigns a single, static Y value to all data points. Enter the value into the text box.
- or -
-
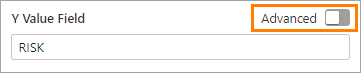
Y Value Field: Derives Y values from a field. Enter the field name into the text box.
-
Chart Type
This section allows you to specify the chart type and configure its display.
The available chart types are as follows:
Click Chart Display Options to configure the colors, lines, symbols, and fonts used to display the chart. Note that the options vary depending on the chart type.
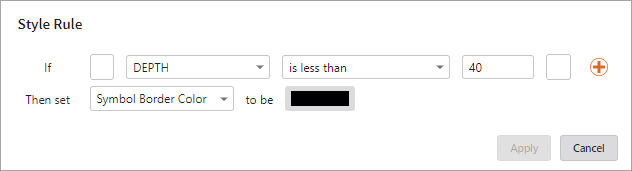
The Inline Designer includes a Style Rule builder that makes it easy to create simple functions to control the display of the chart's symbols at runtime.
Each style rule consists of a Boolean conditional expression (if-then statement). At runtime, the expression is evaluated to determine how the symbol displays on the chart.
- If a style rule is not created properly, the values configured in the Symbol Options section are used.
- If you configure style rules, these will override any advanced functions configured to set the display of the chart. See Arcade Script Examples.
To create a style rule:
-
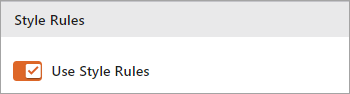
Enable the Use Style Rules option.
-
Click Add Rule. The Style Rule builder opens.
-
In the first row, create the comparison expression—the if statement:
-
In the first drop-down list, select the field whose value will determine the symbol display.
-
In the second drop-down list, select the appropriate comparison operator.
-
In the text box, enter the value to be compared with the field value.
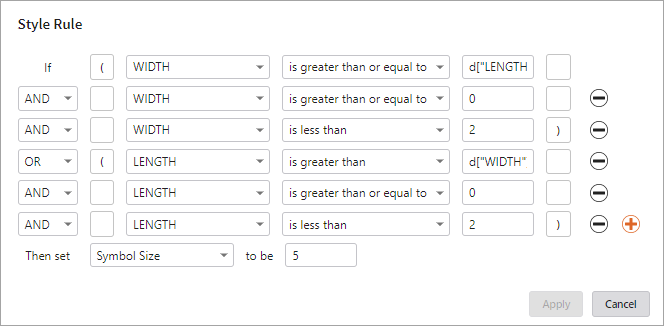
You can enter a discrete value, or you can reference the field whose value will be used at runtime. To do this, use the data context (d) function (for syntax details, see Advanced Configuration).
-
-
In the second row, create the outcome of the evaluated expression—the then statement.
-
In the first drop-down list, select the symbol attribute you want to configure.
-
Set the attribute property to be applied. This may be color, line width, shape, etc., depending on the attribute selected.
-
-
(Optional) To add another comparison expression:
-
Click
 .
. A new row is added to the if statement section.
-
Select AND or OR, as appropriate.
-
Complete the statement as described above.
-
-
Click Apply.
When building complex expressions, we recommend that you enclose sections of the expression in parentheses, to clarify the expression logic and the order in which the expression conditions are evaluated.
Simply click inside the square text boxes at the start and end of the expressions you would like to enclose in parentheses.
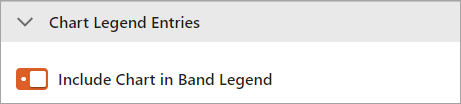
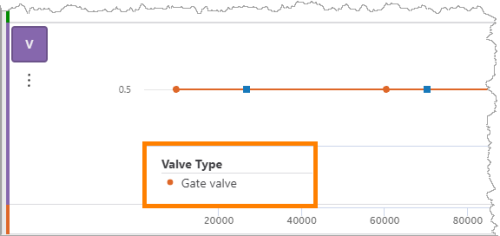
The Inline Designer allows you to manually add and configure chart legend entries. These entries appear at the bottom of a band to identify what the chart lines and symbols represent.
To configure chart legend entries:
-
Enable the Include Chart in Band Legend option.
-
Enter a Group Title. This title appears as the heading for the chart legend entries.
-
Click Add Entry.
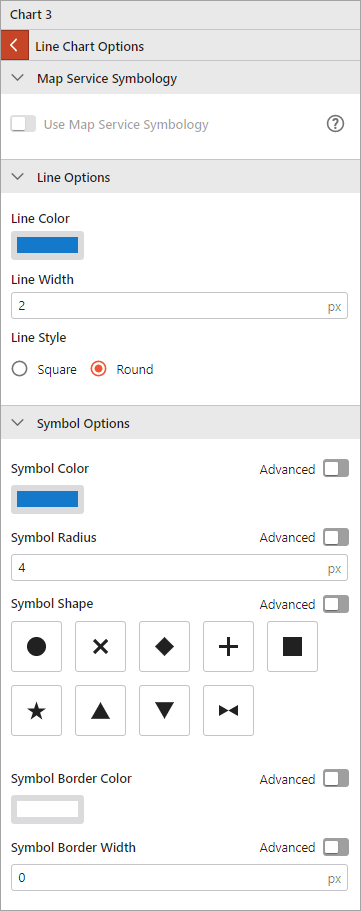
The Legend Entry dialog opens. The available options depend on the Chart Type you selected. The image below shows the options for a line chart.
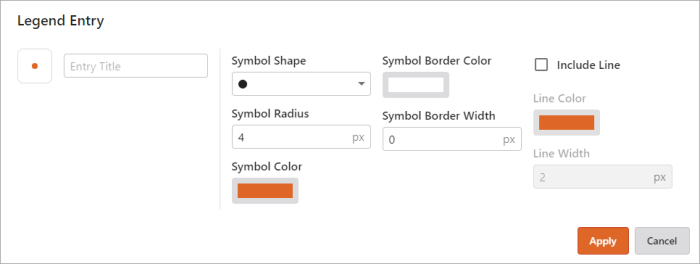
Legend Entry options for a line chart
-
Enter an Entry Title. This title identifies what the symbol represents on the chart.
-
Configure the symbol options for the legend entry.
-
Click Apply.
The legend entry appears on the band.
-
Repeat for each entry you want to appear in the legend.
Identify and Filtering Options
Allow Data Filtering
The Allow Data Filtering option lets you configure the filterable fields for a specific chart. The user can then create conditions based on these fields to filter visible chart data at runtime.
To configure data filtering:
-
Enable the Allow Data Filtering option.
-
Click Edit Filterable Fields to open the Select Fields window.
The fields in the Select Fields window depends on the chart data source:
-
If the data source is a map service layer, a list of all layer fields appears. Select the options you want available to users in runtime to create filters.
-
If the data source is a custom data source, two fields appear: Field Name and Field Alias. Enter the required Field Name as it appears on the data source. Field Alias is optional and allows you to enter a user-friendly name. Click Add to put the selected field into the list. You can add as many fields as you like.
-
-
Click Accept to apply the changes.
Tooltip Text Configuration
These options let you configure the tooltip font size and color.
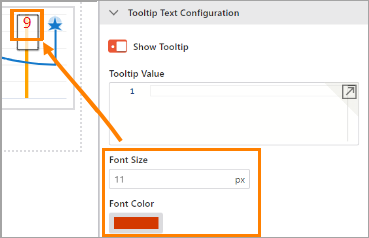
By default, the tooltip displays the Y axis value at the current point on the chart. If required, you can configure a text function that sets the tooltip text at runtime, when the view is loaded in the application.
-
Data Source:
-
Select a data source from the drop-down list.
- or -
-
Click Add New Data Source to add a new data source. For details on configuring data source options, see Configure Data Source Options.
-
-
If your data does not have Y values, you can choose one of the following options:
-
Y Value: Assigns a single, static Y value to all data points. Enter the value into the text box.
- or -
-
Y Value Field: Derives Y values from a field. Enter the field name into the text box.
-
Actions
Actions are configured events that users can trigger from a band, chart or feature in an VertiGIS Inline view. For example, you might want to create an action that allows the user to print a report from a chart or search for data on the map.
See Work with Actions.
Edit a Chart
-
In the View panel, the Bands section lists all of the bands configured for the view. Click the band that contains the chart you want to edit.
-
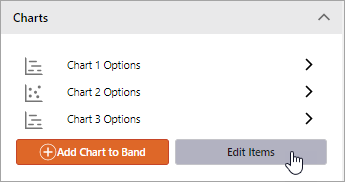
In the Band Options panel, the Charts section lists all of the charts in the band. Click a chart to open the Chart Options panel.
-
To edit the chart options, follow the steps outlined in the previous sections:
Delete a Chart
You can delete a chart from the Band Options panel or from the Chart Options panel.
To delete a chart from the Band Options panel:
-
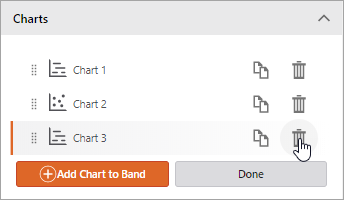
In the Band Options panel, the Charts section lists all of the charts in the band.
-
To delete a chart, click Edit Items.
-
Click the appropriate Delete button.
-
You will be prompted to confirm the deletion. Click Yes to proceed or No to cancel.
-
Click Done.
To delete a chart from the Chart Options panel:
-
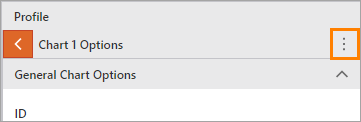
In the Band Options panel, the Charts section lists all of the charts in the band. Click a chart to open the Chart Options panel.
-
In the upper-right corner of the panel, click the More button.
-
Click Delete.
-
You will be prompted to confirm the deletion. Click Yes to proceed or No to cancel.
Copy a Chart
-
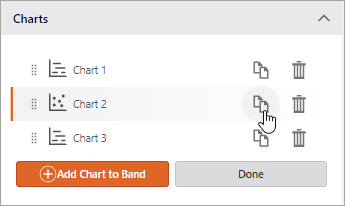
In the Band Options panel, the Charts section lists all of the charts in the band.
-
To copy a chart, click Edit Items.
-
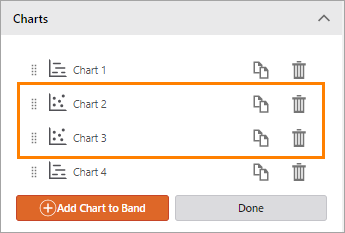
Click the appropriate Copy button.
The chart is copied to the main Designer workspace and listed in the Charts section of the Band Options panel.
-
Click Done.