Work with Data Sources
In VertiGIS Inline, a data source is the web map layer associated with a chart. Typically, every chart will have its own unique data source.
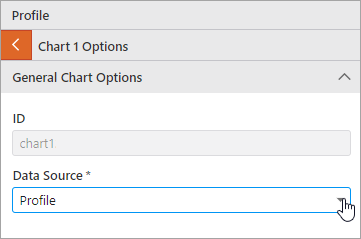
Before you can add a chart to a view, you must add the related data source to the view's Data Sources panel. The new data source is automatically added to the Data Source drop-down list on the Chart Options panel.
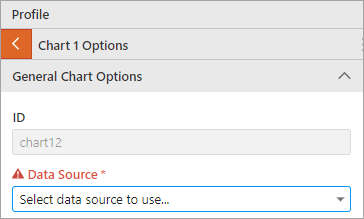
When you create your first view, the Data Source drop-down list on the Chart Options panel will only contain the data source for the default Points of Interest band.
When adding a data source to a view, you can:
-
Import a data source from views you have saved previously
-
Add a token to your data source configuration. Tokens allow for the dynamic replacement of data source field values at runtime.
There is no limit to the number of data sources you can add to a view.
Add a Data Source
There are two ways to add a data source to a view:
-
On the left toolbar, click Data Sources, and then click Add Data Source.
-
When adding a chart to a band, on the Chart Options panel, click Add New Data Source. (See Work with Charts.)
Configure Data Source Options
-
Configure data source options as follows:
-
Name: Enter a name for the data source.
-
Data Source Type: Choose the data source type to use as the basis for your chart. Select from the following options:
-
Map Service: Select this option if you want to base your chart on a map service.
-
Custom: Select this option if you want to base your chart on a layer.
-
Workflow: Select this option if you want to base your chart on an external workflow (created in VertiGIS Studio Workflow) that will return feature set data at run-time and display it in the chart.
The Point of Interest data source type is required for the configuration of the default POI band only. Do not select this for your own data source.
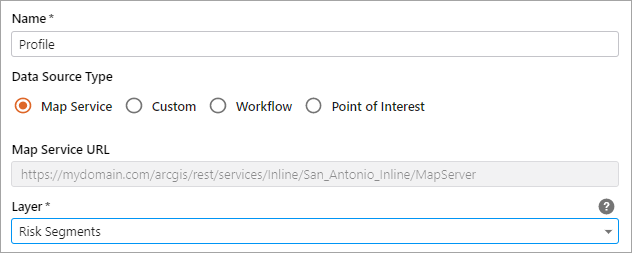
Map Service data source configuration
-
The Map Service value is automatically set to the URL specified in the Map Options panel.
-
From the Layer drop-down list, select the map layer from which your chart will draw its data.
The layer must have a measure value field—or begin and end measure values if a linear feature layer, and a foreign key field that matches the unique ID field in the centerline layer.
The Designer populates the drop-down lists in the Data Sources panel with information found in the selected layer.
To complete your map service data source configuration, follow the instructions in the Map Service and Custom data source configuration settings table below.
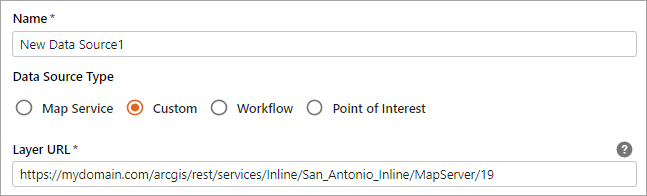
Custom data source configuration
-
In the Layer URL text box, enter the URL of the map layer from which your chart will draw its data.
The map layer must have a measure value field—or begin and end measure values if a linear feature layer, and a foreign key field that matches the unique ID field in the centerline layer.
To complete your custom data source configuration, follow the instructions in the Map Service and Custom data source configuration settings table below.
Map Service and Custom data source configuration settings
Setting
Description
Layer URL
The URL of the map layer from which your chart will draw its data. Must have a measure value field, or begin and end measure values if a linear feature layer, and a foreign key field that matches the unique ID field in the centerline layer.
Unique ID Field
The name of the layer's unique ID field. For ArcGIS layers and tables this can be OBJECTID, but another unique ID field may be used if one exists.
Centerline Join Field
The name of the layer's centerline foreign key field.
Data Type
The type of data that will be displayed. Choose Point for point and line charts and Linear for linear charts.
Depending on the type of layer you selected, specify a measure field or begin / end measure fields (shown below).
Measure Field
The field to use for the X axis values
Begin / End Measure
The fields that hold the measure values of the start and end of the linear feature data on which the chart is based.
Use Custom Definition Query
(Optional) Enable this option if you want to filter the data displayed in the view by constructing a custom definition query WHERE clause.
Definition Query:
Enter a WHERE clause that specifies the subset of data to display on the chart.
To reset the query to the default auto-generated query, click the
 Refresh button.
Workflow data source configuration
-
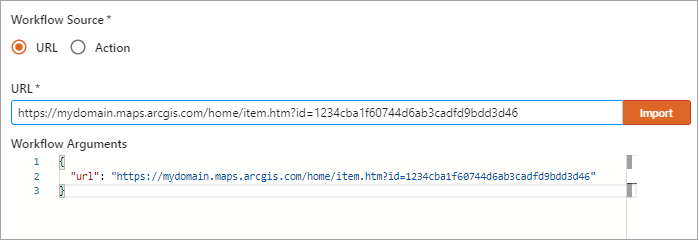
Select the appropriate Workflow Source:
-
URL: Enter the workflow URL.
You can copy/paste the URL directly into the text box, or click Import to browse your ArcGIS Online or Portal for ArcGIS content and select the appropriate workflow.
The URL is added to the Workflow Arguments section.
-
Action: From the drop-down list, select the action that is configured to call the workflow you want to use.
See Work with Actions.
-
-
Data Type: Specify whether the workflow source includes point or linear data.
-
Point: Specify the Measure Field—the field to use for the X axis values.
-
Linear: Specify the Begin Measure Field and End Measure Field—the fields that hold the measure values of the start and end of the linear feature data on which the chart is based.
-
-
-
-
-
Click Apply.
The new data source displays on the Chart Options panel, in the Data Source drop-downlist.
Import a Data Source
-
In the left toolbar, click Data Sources, and then click Import Data Source.
-
In the Import window, select the view containing the data sources you want to import.
-
Click Open.
All data sources in the selected view are imported and added to the list in the Data Sources panel.
Add a Token
Tokens allow for the dynamic replacement of database field values at runtime. When the user runs a view in the browser, a WHERE clause filters and extracts the appropriate data. Any tokens in the WHERE clause are replaced with their corresponding field values.
For example, suppose you configure a feature action that invokes a workflow. You can use a token to replace the value of the feature at runtime.
To add a data source token:
-
In the left toolbar, click Data Sources, and then click Add Data Source.
-
Complete the field values as described above.
-
Click Add Token.
-
Configure the following required fields as follows:
-
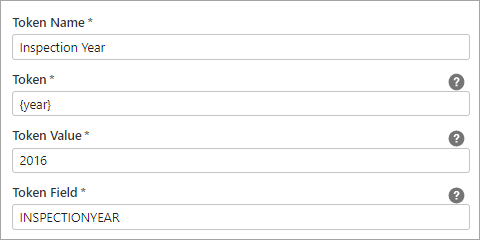
Token Name: Enter a name for the token (for example, Inspection Year).
-
Token: Enter the token to be replaced with a value at runtime. This value must be enclosed in curly braces (for example, {year}).
-
Token Value: Enter the default value used to replace the token if a value is not supplied by the user at runtime (for example, 2016).
-
Token Field: Enter the data source field whose value will replace the token at runtime.
-
-
Configure the following optional fields as follows:
-
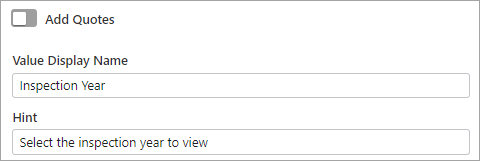
Add Quotes: Enable this option if the value that is replacing the token must be enclosed in single quotes in the database WHERE clause. WHERE clauses in ArcGIS endpoints must receive Text field values inside single quotes.
-
Value Display Name: Enter the display name of the lookup value. This will be seen by the user, so should be meaningful and reflect what the token value represents (for example, Inspection Year).
-
Hint: Enter tooltip text that will help the user to select the appropriate token value.
-
-
(Optional) Configure one or more lookup values. Lookup values allow the user to select the value to be used in the WHERE clause that extracts the data for the view.
You can configure lookup values that correspond to fields in an existing data source (for example, the INSPECTIONYEAR field in another data source), or you can configure hard-coded values (for example, 2020 and 2010).
-
Configure a data source lookup value:
-
Datasource ID: Enter the ID of the data source that contains the lookup field. This must be an existing data source. You can copy the ID from the Data Source panel.
-
Display Field Name: Enter the display name of the lookup field. This will be seen by the user, so should be meaningful.
-
Value Field Name: Enter the name of the field to use for the lookup.
-
-
Configure a hard-coded lookup value:
Click Add Lookup Value and configure as follows:
-
Name: Enter the name of the lookup value.
-
Value: Enter the lookup value.
-
-
-
Click Save.
Delete a Data Source
-
In the left toolbar, click Data Sources.
-
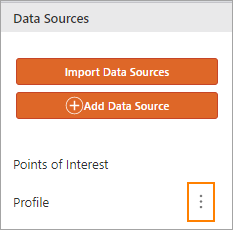
The Data Sources panel lists all of the data sources configured for the view. Locate the data source you want to delete, and click its More button.
-
Click Delete.
-
You will be prompted to confirm the deletion. Click Yes to proceed or No to cancel.
You cannot delete the built-in Points of Interest data source.