Key Concepts
Actions
Actions are configured events that users can trigger from a band, chart or feature in an VertiGIS Inline view. For example, you might want to create an action that allows the user to print a report from a chart or search for data on the map.
- All actions are triggered from the context menu of the band, chart or feature.
- Actions triggered from a feature are known as feature actions.
See also...
Bands
In the VertiGIS Inline Designer, bands are used as containers that allow you to group together related charts. Before you can add a chart to a view, you must first create a band.
See also...
Charts
You can add the following types of charts to an Inline view:
- Line chart
- Linear chart
- Scatter chart
- Area chart
- Area range chart
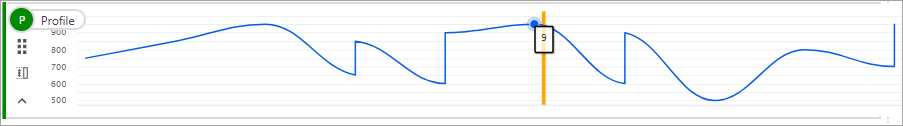
Line chart
Line charts display data as a series of points connected by lines. The Inline Designer lets you choose to connect your data points with straight or curved lines.
Linear chart
Linear charts always display information as a straight line.
They are used to display linear features for which the rate of change is constant for y values in relation to x values.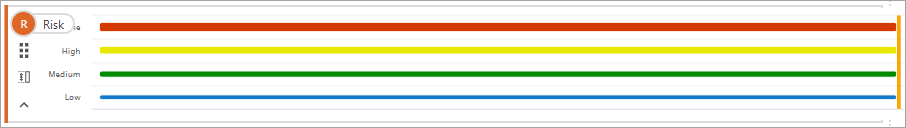
They are also used to display linear features that have values that can be used to sort features on the y axis.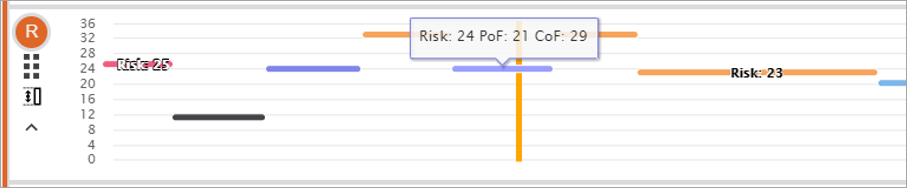
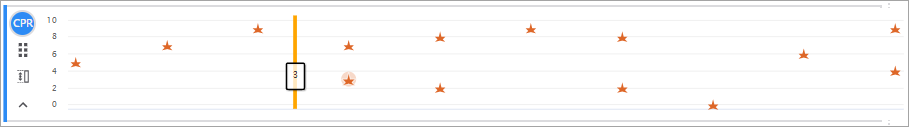
Scatter chart
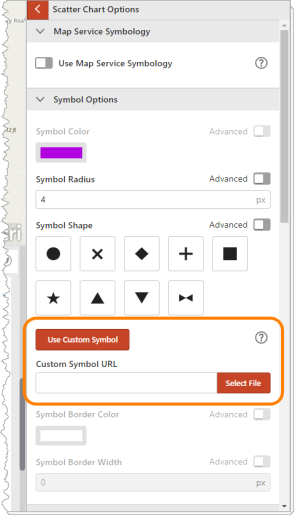
Scatter charts use points to represent values for two different variables, and show the relationship between those variables. Traditionally, each individual data point is represented by a dot on the chart, but the Inline Designer lets you customize the symbol used.
By default, each individual data point is represented by a dot on the chart. However, the Inline Designer lets you customize the symbol options.
You can also use a custom marker symbol to represent data points. Click Use Custom Symbol to either specify a URL to a publicly-accessible image or uploading an image from your device. Uploading an image is the preferred option, as many servers do not have the proper Access-Control-Allow-Origin headers set and return an error.
To upload an image, the view must already be saved as a portal item. When using an image symbol, you may change the symbol size but no other symbol settings will be applied. Best results are achieved if the image used has a square aspect ratio.
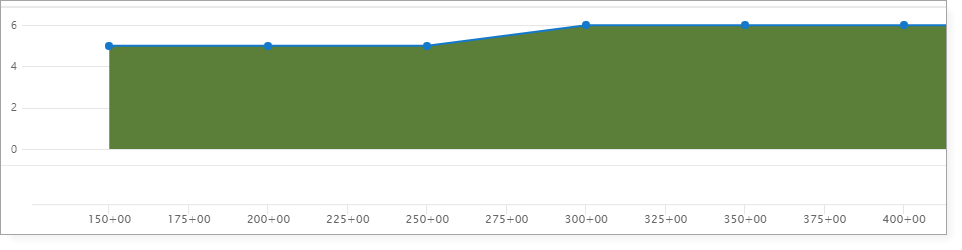
Area Chart
Area charts require a single Y value and create a filled polygon between 0 and the Y value. Negative Y values are supported but the chart will always be plotted from 0 to the Y value.
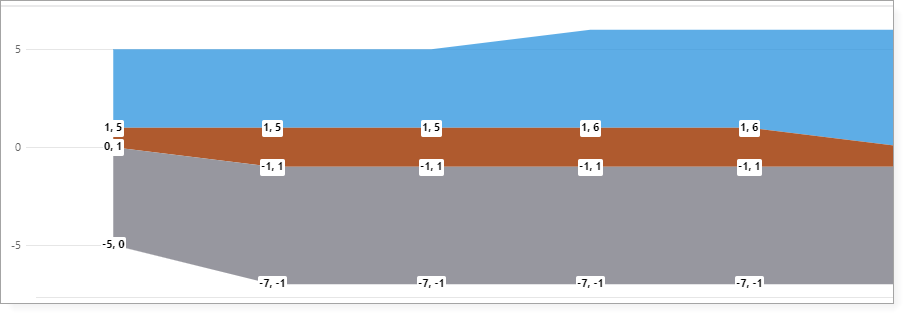
Area Range Chart
Area range charts require two Y values and create a filled polygon between the Y1 and Y2 values. Negative values are supported and can span the 0 point of the chart. Multiple area range charts can be added to a band to create a cross profile view of the data.
See also...
Data Sources
In VertiGIS Inline, a data source is the web map layer associated with a chart. There is no limit to the number of data sources you can add to a view.
See also...
Designer
VertiGIS Inline has a web-based Designer that you use to create and customize a view. The Designer allows you to add data sources, bands, and charts, and configure actions and functions that operate within those views.
To sign in to the Designer, you must have an ArcGIS Administrator account.
Functions
In VertiGIS Inline, functions are advanced configuration options that allow you add functionality to your views. You can use functions for many purposes, but they are often used to insert variable values into the headings and labels displayed on a chart, or to customize the data that is displayed in a chart at runtime.
See also...
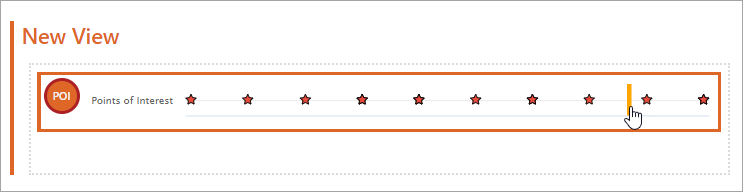
Points of Interest
By default, every new view you create contains a Points of Interest (POI) band. There is no need to configure this band. Its presence allows your users to add points of interest (actions) to the charts contained in your published views. If you do not want your users to be able to add points of interest, you can delete this band.
Note that Add Point of Interest and Remove Point of Interest are built-in actions.
View
A view is the end result of your configuration in the VertiGIS Inline Designer.
In summary, a view:
- Contains the charts (grouped into one or more bands) you have configured for your selected data source(s).
- Provides the interface that the user opens in a browser-based web map application.
- Allows the user to visualize and interact with your linear referenced data.