Description
Allows you to create a pivot table for multi-dimensional analysis of large amounts of data.
The image below is an example of a Pivot Grid at runtime.
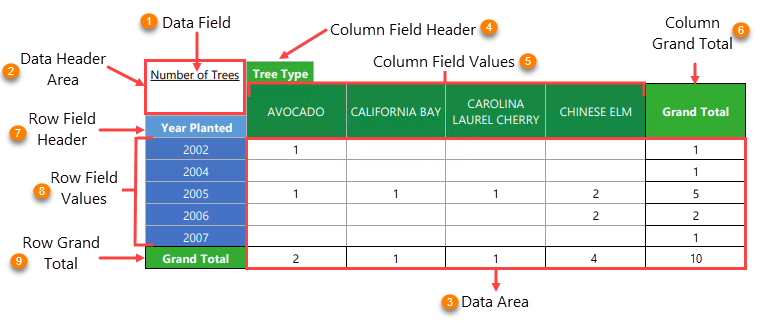
1.Data Field: A field or fields that have been added to the Data Header Area (2)
2.Data Header Area: Contains any Data Fields
3.Data Area: Displays data cells, total cells and grand total cells.
4.Column Field Header: Displays the caption from the field or fields added to the Column Field Header.
5.Column Field Values: Displays values from the field as column headers.
6.Column Grand Total: Column that displays summary totals calculated against all columns.
7.Row Field Header: Displays the caption from the field or fields added to the Row Field Header.
8.Row Field Values: Displays values from the field as row headers.
9.Row Grand Total: Row that displays summary totals calculated against all rows.
Properties Common to Most Controls
For more information about the properties listed below, see Properties Common to Most Controls.
•Actions: Align to Grid, Size to Grid, Center Horizontally, Center Vertically, Bring to Front, Send to Back, Fit Bounds to Container
•Styles: Even Style, Odd Style, Style
•Appearance: Background Color, Border Color, Border Dash Style, Border Width, Borders, Font Name, Font Size, Font Unit, Font Effects, Foreground Color, Padding
•Behavior: Can Publish, Keep Together, Visible
•Data: Tag
•Design: Name
•Layout: Location, Size
•Navigation: Bookmark, Parent Bookmark, Navigation URL
For more information regarding each of the property groups, see the Control Reference.
Actions
Actions |
Align to Grid Size to Grid Center Horizontally Center Vertically Bring to Front Send to Back Fit Bounds to Container A container includes a band or a panel. This property is only enabled if the control is the only item in the container. Insert Field in the Data Area Insert Field in the Column Area Insert Field in the Row Area |
Data Source |
Type: Object Sets the control's data source. If left empty, the report's data source is used. |
Data Member |
Type: String Specifies the data source table, which supplies data to the control. |
 Snaps the upper left corner of the control to the grid.
 Resizes the control so all four corners are snapped to the grid.
 Centers the control within the width of the parent container.
 Centers the control within the height of the parent container.
 Positions the control in front of any overlapping controls.
 Positions the control behind any overlapping controls.
 Resizes the control to occupy the entire parent container, excluding the borders.
 Inserts a field into the Data Header Area.
 Inserts a field into the Column Field Header.
 Inserts a field into the Row Field Header.
Behavior
Anchor Vertically |
Sets the location of the control in relation to the parent container. When the parent container changes size, the control may move or resize to maintain its position. The options for vertically anchoring include: •None: The control's size and location are not affected when the container size changes. •Top: The distance between the top of the control and the top of the container remains fixed when the container size changes. •Bottom: The distance between the bottom of the control and the bottom of the container remains fixed when the container size changes. •Both: The distance from the top and bottom of the control from the top and bottom of the container remains fixed when the container size changes. This means that control is resized to maintain these fixed distances. |
Anchor Horizontally |
Sets the location of the control in relation to the parent container. When the parent container changes size, the control may move or resize to maintain its position. The options for horizontally anchoring include: •None: When the parent container changes size, the control's size and location are not affected when the container size changes. •Left: The distance between the left edge of the control and the left side of the container remains fixed when the container size changes. •Right: The distance between the right edge of the control and the right side of the container remains fixed when the container size changes. •Both: The distance from the left and right edges of the control from the left and right sides of the container remains fixed when the container size changes. This means that control is resized to maintain these fixed distances. |
Data
Data Source |
Type: Object Sets the control's data source. If left empty, the report's data source is used. |
Data Member |
Type: String Specifies the data source table, which supplies data to the control. |
Prefilter |
The Prefilter property contains the following options: Criteria: Sets a filter criteria applied to data displayed in the Pivot Grid. Enabled: Sets whether to apply a filter criteria specified using the Criteria property. |
Domain-based Expressions
Some expressions require access to the complete feature object to evaluate correctly. For example, expressions such as getDomainDescription() retrieve the description associated with a coded value domain.
The Pivot Grid operates on the fields that are available in its pivot dataset rather than the complete feature object. Because of this, expressions that require the full feature context may not return the expected results when used directly in Pivot Grid calculations.
For example, the following expression may not evaluate correctly when it is used directly in a Pivot Grid expression:
getDomainDescription([@Feature], 'ART')
The Expression Editor may show only the fields available in the pivot dataset, rather than the complete feature object.
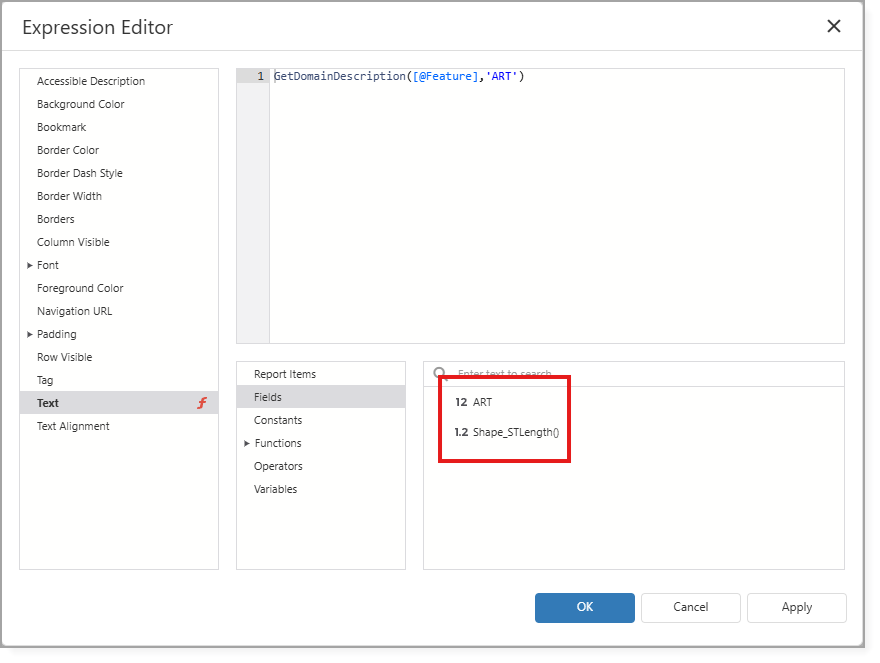
If you need to use an expression that requires the complete feature context, create a calculated field in the report data source before configuring the Pivot Grid.
To create a calculated field for use in a Pivot Grid:
1.Open the report's data source configuration.
2.Add a calculated field.
3.Enter the required expression, such as getDomainDescription().
4.Save the data source.
5.Configure the Pivot Grid to use the calculated field instead of the original field.
6.Generate the report.
The calculated field is evaluated when the data source is processed, where the complete feature object is available. The Pivot Grid can then use the resulting value for grouping, aggregation, and display.
Related Tutorials
Refer to the following resources for additional help on implementing this control:
