When you build a client workflow, it is useful to be able to examine each activity as it runs. Verbose logging allows you to do this. When verbose logging is turned on, you can use your console to debug running workflows.
Verbose logging is for client workflows only. It does not work for server workflows.
Verbose logging records the input values that each activity operates on and the output values that they produce. The information is written to the console when you run the workflow. This provides a trace of the running workflow that you can use to debug the workflow.
In addition to verbose logging, VertiGIS Studio Workflow has a Log activity that you can use to write custom messages to the console.
To open the console:
▪If you are running the application in a browser (VertiGIS Studio Web, Geocortex Viewer for HTML5, or ArcGIS Web AppBuilder): Open the browser tab where the workflow is running and press F12 to open the browser console.
▪If you are running VertiGIS Studio Mobile: Select the I Want To Menu > Settings and select Log Viewer to open the log viewer console.
The browser console in VertiGIS Studio Web, Geocortex Viewer for HTML5, and ArcGIS Web AppBuilder uses a JavaScript runtime.
The console in VertiGIS Studio Mobile uses a .NET runtime, which uses a different syntax compared to a JavaScript runtime and may provide a different level of detail.
Turn On Verbose Logging
To use verbose logging, you should be familiar with the console for your chosen browser. Refer to the browser's documentation for help. If you use Chrome, Using the Console is a good place to start.
Verbose logging is turned off by default, except for in the Sandbox. The Sandbox has verbose logging turned on by default.
To use verbose logging when you run a workflow in a host application, you must turn on verbose logging in the host application.
Below are the steps to turn on verbose logging for the following types of host applications:
In Geocortex Viewer for HTML5, to save yourself from having to reload the page each time you make changes to your workflow, add the dev=true parameter to the URL. For example:
http://host.domain.com/viewer/index.html?viewer=site.viewer&dev=true
When using the preview within VertiGIS Studio Web App Designer, you do not need to reload to see changes to your workflow. However, when testing workflows run outside of Web App Designer, you must reload the application to see your changes.
ArcGIS Web AppBuilder Editor allows you to immediately run changes to a workflow without having to reload. However, when testing workflows in the viewer application, you must reload the viewer.
Turn on Verbose Logging for a VertiGIS Studio Web App
To turn on verbose logging for a VertiGIS Studio Web app:
1.Add the URL parameter debug=true to the app's launch URL.
For example: https://apps.vertigisstudio.com/webviewer/?app=...&debug=true
2.Launch or refresh the application.
3.Press F12 to open the browser console.
4.Set the console's log level:
▪Chrome: Make sure the Verbose level is selected.
You can have other levels selected as well, if you want.
▪Firefox: In the Filter bar, make sure the Debug filter is selected.
You can have other filters selected as well, if you want.
In Edge, verbose logging appears in the console no matter which log levels you choose.
5.Test verbose logging by running the workflow in the application.
Verbose log information appears in the console.
Turn on Verbose Logging for a VertiGIS Studio Mobile App
To turn on verbose logging for a VertiGIS Studio Mobile app:
1.Click the I want to... button.
2.At the bottom of the I want to... panel, click the Settings icon.
3.In the Settings dialog that appears, set the Log Level to Debug.
By default, debug logs are not shown. The debug filter must be enabled in the Log Viewer to display debug logs.
4.To open the log, open the Settings dialog and click Log Viewer at the bottom of the dialog.
5.In the top left corner of the Log Viewer dialog, click Hide Filters.
6.Toggle the Debug filter to the on position to display debug logs in the viewer.
7.Close the Log Viewer and test debug logging by running the workflow in the app.
Workflow specific logs are indicated by [Workflow] at the beginning of the log.
Turn on Verbose Logging for a Geocortex HTML5 Viewer
To turn on verbose logging for a Geocortex HTML5 Viewer:
1.Add one of the following URL parameters to the viewer's launch URL:
dev=true
or
debug=true
2.Launch or refresh the viewer.
3.Press F12 to open the browser console.
4.Set the console's log level:
▪Chrome: Make sure the Verbose level is selected.
You can have other levels selected as well, if you want.
▪Firefox: In the Filter bar, make sure the Debug filter is selected.
You can have other filters selected as well, if you want.
In Edge, verbose logging appears in the console no matter which log levels you choose.
5.Test verbose logging by running the workflow in the viewer.
Verbose log information appears in the console.
Turn on Verbose Logging for a Web AppBuilder App
To turn on verbose logging for a Web AppBuilder app:
These steps assume that you have already configured Web AppBuilder to run the workflow.
1.In ArcGIS Web AppBuilder, edit the app that runs the workflow.
2.Press F12 to open the browser console.
3.Set the console's log level:
▪Chrome: Make sure the Verbose level is selected.
You can have other levels selected as well, if you want.
▪Firefox: In the Filter bar, make sure the Debug filter is selected.
You can have other filters selected as well, if you want.
In Edge, verbose logging appears in the console no matter which log levels you choose.
4.Test verbose logging by clicking the widget in the editor to run the workflow.
Verbose log information appears in the console.
If you run the workflow by clicking the Launch or Preview link in the editor, verbose logging will not appear in the console. To show verbose logging, you must run the workflow by clicking the widget within the Web AppBuilder editor.
Interpret a Verbose Log

Example of a verbose log for a workflow with two activities, shown in Chrome
Log entries are recorded in the order that the activities run (with some variation for activities with subworkflows—see Example 3 - Verbose Log for a Display Form Activity for an example).
You can identify an activity by its ID, if it has one (for example, query1), or from its position in the log and unique action name (for example, gcx:wf:arcgis::query:QueryTask).
Log entries are often in pairs:
▪An entry with a right arrow (-->) at the beginning indicates that the activity is about to run.
This line records the inputs and outputs going into the activity. Because the activity has not yet run, the outputs are undefined. The inputs are specified in the activity's configuration, so they have values.
▪An entry with a right arrow (-->) after the name or ID indicates that the activity has finished running.
This line records the inputs and outputs when the activity finishes running. The outputs should now have values. The inputs are the same as going into the activity.
Log entries are initially collapsed. You can expand and collapse the entries. You can also expand and collapse objects by clicking the object. In some browsers, objects are represented as "…".
Ignore the log entries labelled __proto__. They are not useful to workflow authors.
Example 1 - Verbose Log for Prompt and Confirm Activities
This example shows the verbose log for a workflow with two activities, a Prompt activity and a Confirm activity. The activities are configured as follows:
Activity |
Input |
Configuration |
Prompt |
Description Default Text |
Enter your name Name |
Confirm |
Text |
="You entered "+$prompt1.result+"." |
Running the workflow gives the verbose log shown below. In the screen capture, the log entries are partially expanded so you can see the input and output values.
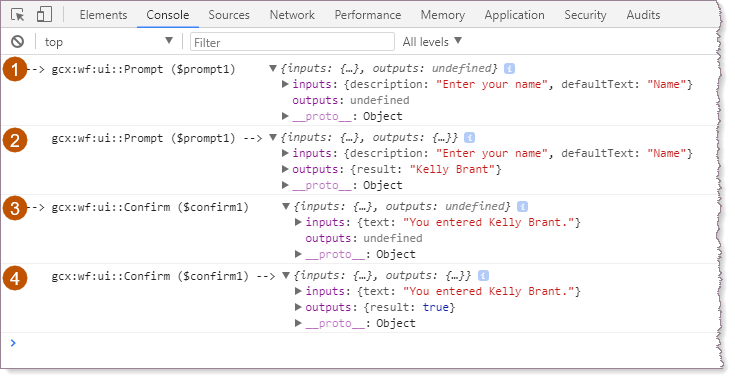
Verbose log for a workflow with two activities, Prompt and Confirm, shown in the Chrome console
 |
Entering the Prompt Activity: The values of the inputs going into the Prompt activity are configured in Workflow Designer. The outputs are undefined, because the activity has not yet run. |
 |
Exiting the Prompt Activity: The inputs are the same as they were entering the activity. The Prompt activity's output, result, now has a value, specifically, the text that the user entered into the prompt. |
 |
Entering the Confirm Activity: The Confirm activity's input, text, combines static text configured in Workflow Designer with a run-time value, the Prompt activity's result output. The outputs are undefined, because the activity has not yet run. |
 |
Exiting the Confirm Activity: The inputs are the same as they were entering the activity. The output, result, now has a value, true, which indicates that the user clicked the Confirm dialog box's OK button. If the user had clicked the Cancel button, result would be false. |
Example 2 - Verbose Log for a Query Layer Activity
This example shows the verbose log for a Query Layer activity. The query gets the geometry and two attributes for the US states in the Middle Atlantic region (New York, Pennsylvania, and New Jersey).
The Query Layer activity is configured as follows:
Activity |
Input |
Configuration |
Query Layer |
Url Where Return Geometry Output Fields |
https://sampleserver6.arcgisonline.com/arcgis/rest/services/Census/MapServer/3 SUB_REGION='Middle Atlantic' true STATE_NAME, POP2007 |
Running the workflow gives the verbose log shown below. In the screen capture, the log entries are partially expanded so you can see the input and output values.
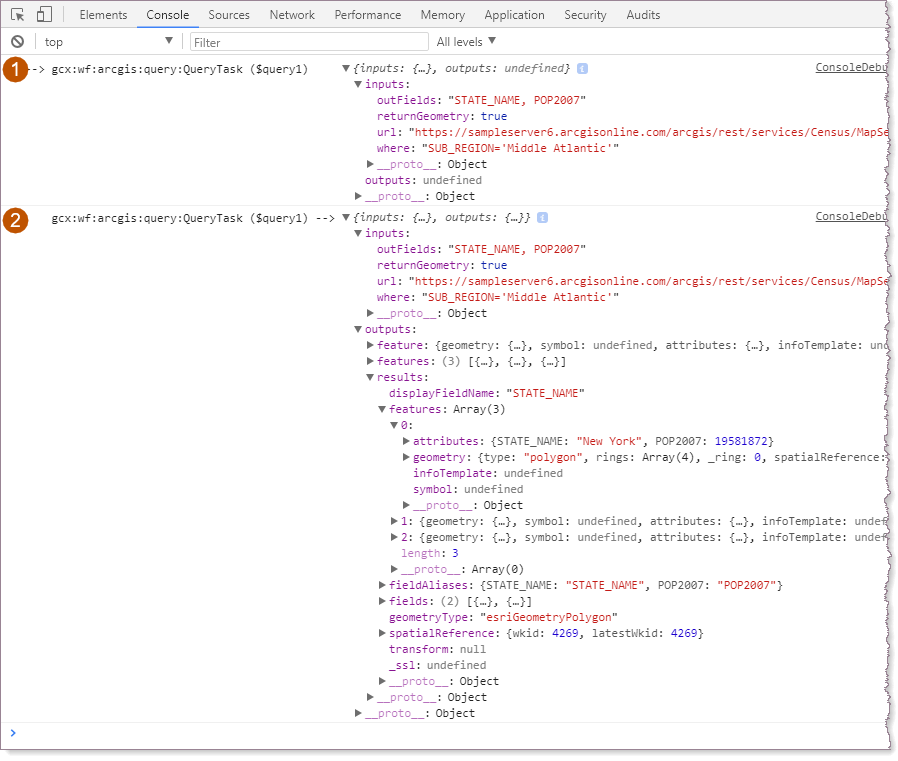
Verbose log for a workflow with one activity, Query Layer, shown in the Chrome console
 |
Entering the Query Layer Activity: The values of the inputs are configured in Workflow Designer. The outputs are undefined, because the activity has not run yet. |
 |
Exiting the Query Layer Activity: The Query Layer activity has three outputs: ▪feature: (esri.Graphic (3.x, 4.x)*) The first feature returned by the query. ▪features: (esri.Graphic[] (3.x, 4.x)*) A collection of features returned by the query. ▪results: (esri.FeatureSet (3.x, 4.x)*) The feature set returned by the query. The entry for the results output is shown partially expanded in the screen capture. The results output has a features property that is a collection of the features returned by the query. The first feature, features[0], is expanded to show its attributes, geometry, and symbol. * VertiGIS Studio Workflow uses different versions of Esri's ArcGIS API for JavaScript depending on the type of host application. See Underlying Technologies for information. |
Example 3 - Verbose Log for a Display Form Activity
This example show the verbose log for a workflow with a Display Form activity.
The form has two elements, a Radio Group and a Check Box. The Check Box is only shown when the user selects a particular radio button, specifically, the first radio button.
The Radio Group has two subworkflows:
▪ArcGIS Query Subworkflow: The ArcGIS Query subworkflow creates the radio buttons for the Radio Group.
▪Change Event Subworkflow: The change event's subworkflow runs when the user selects a different radio button. If the user selected the first radio button, the subworkflow shows the Check Box. If the user selected one of the other radio buttons, the subworkflow hides the Check Box.
The workflow has the following activities:
Location |
Activity |
Main workflow |
Display Form |
ArcGIS Query subworkflow |
Query Layer Get Form Element Items Form Features Set Form Element Items |
Change event subworkflow |
If Set Form Element Property (If = true) Set Form Element Property (If = false) |
Running the workflow gives the verbose log shown in the screen capture. In this case, the user selected a radio button and then submitted the form without making any additional selections, either to the Radio Group or to the Check Box. This means that the change event's subworkflow only runs once.
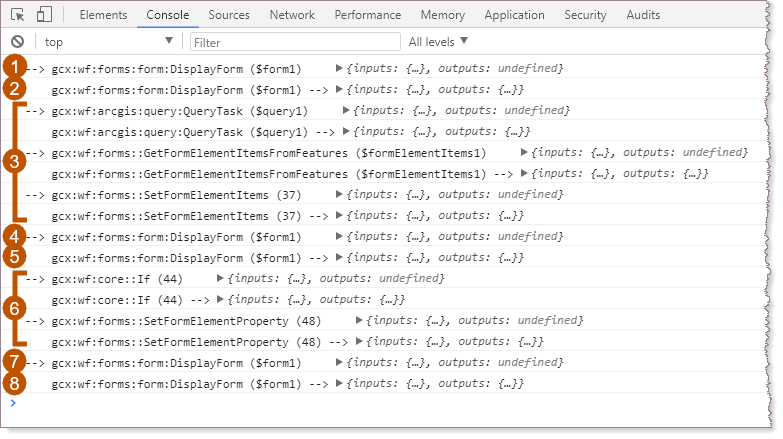
Verbose log for a workflow with a Display Form activity that has two subworkflows, shown in the Chrome console
Additional Log Entries
Activities with subworkflows have an additional pair of log entries for each subworkflow. In this example, the Display Form activity has two subworkflows, so the log has three pairs of log entries for the Display Form activity ( /
/ ,
,  /
/ , and
, and  /
/ ).
).
 |
Entering the Display Form activity for the first time |
 |
Exiting the Display Form activity in preparation for running the ArcGIS Query subworkflow |
 |
The ArcGIS Query subworkflow's log entries: ▪Entering the Query Layer activity ▪Exiting the Query Layer activity ▪Entering the Get Form Element Items From Features activity ▪Exiting the Get Form Element Items From Features activity ▪Entering the Set Form Element Items activity ▪Exiting the Set Form Element Items activity |
 |
Entering the Display Form activity after the ArcGIS Query subworkflow completes |
 |
Exiting the Display Form activity in preparation for running the change event's subworkflow |
 |
The change subworkflow's log entries: ▪Entering the If activity ▪Exiting the If activity ▪Entering the Set Form Element Property activity ▪Exiting the Set Form Element Property activity |
 |
Entering the Display Form activity after the change event's subworkflow completes |
 |
Exiting the Display Form activity for the final time |
Intermediate Outputs
Verbose logs show intermediate outputs for activities with subworkflows.
Expanding the outputs for  shows the intermediate outputs of the Display Form activity after the ArcGIS Query subworkflow completes. The event type is populate (
 ). Populate events create form element items, in this case, radio buttons for the Radio Group. The items created by the subworkflow are shown at
  .
.
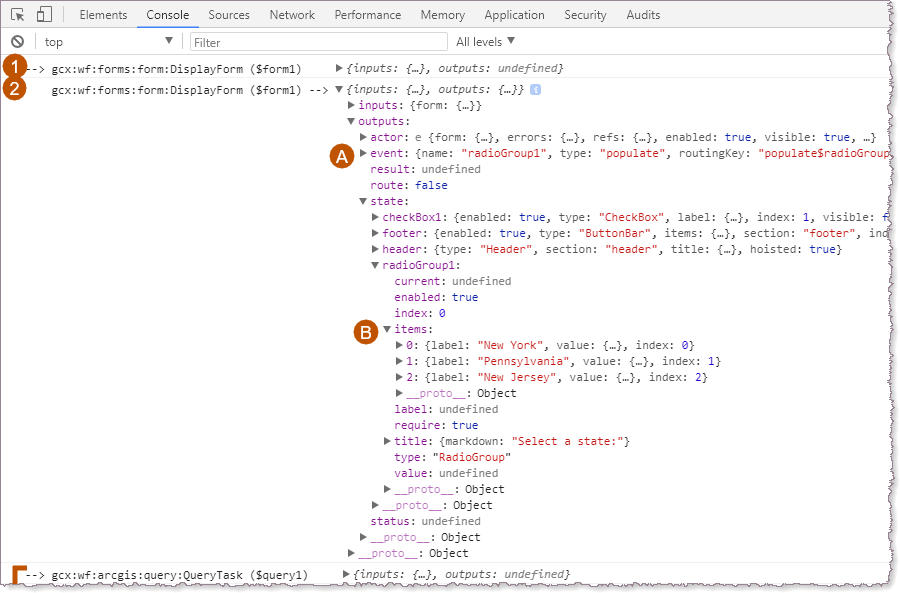
Outputs of the ArcGIS Query subworkflow
Expanding the inputs for  shows the Display Form activity's intermediate outputs after the change event's subworkflow completes. The type is changed (
 ). The log indicates that the user selected the first radio button, which has index = 0 (
 ) and label = New York (
 ).
).
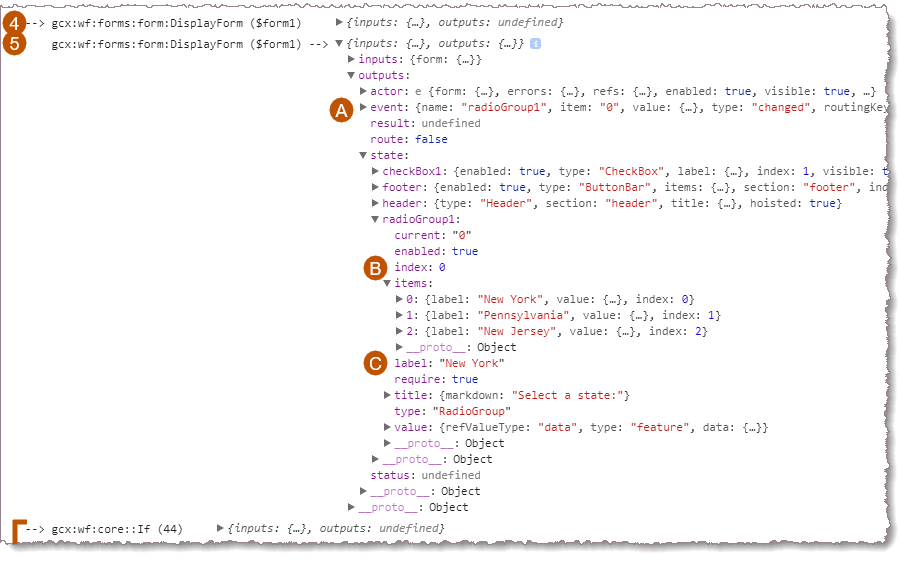
Outputs of the change event's subworkflow
Retrieving the logs from a Server Workflow
When a server workflow is executed, its logs are not written directly to the browser like in a client workflow. Instead, they are stored on the server and a link is sent to the client.
To see the logs from a Server Workflow run via the Run Workflow activity in a browser, perform the following steps.
1.Follow the instructions in the To open the console section at the top of this page to open the browser console.
2.Run the workflow.
3.After the server workflow completes, an object should be visible in the console with two properties: results and log.
Ensure that the console is not filtering debug output. In Chrome, ensure "Verbose" is selected in the drop-down list at the top of the console. In Firefox, ensure that the "Debug" button is selected at the top of the console.
4.Expand Object > log > traces.
5.Click the url beside the text Information: 0: Logs:. The logs are opened in a separate tab.
It is not currenty possible to retrieve logs from a Server Workflow in VertiGIS Studio Mobile or VertiGIS Studio Desktop for ArcGIS Pro.