Measurement Module
This module can be partially configured using Manager. For instructions, see Tool Behavior.
The Measurement Module implements the ability to measure distances and areas on the map.
For a user to be able to perform measurements, you must add one or more measurement tools to the toolbar. Alternatively, you could add measurement tasks to the I Want To menu or create workflows that prompt the user to perform a measurement. The HTML5 Viewer provides a set of commonly-used measurement tools that you can add to the toolbar.
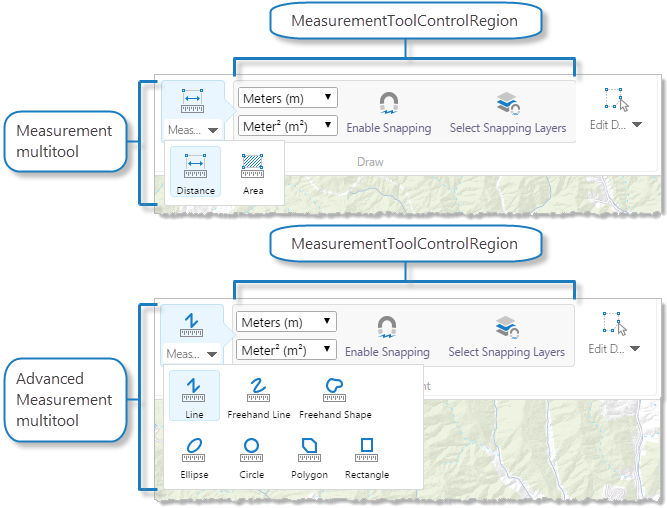
Measurement tools (top), and Advanced Measurement tools (bottom) in the Desktop and Tablet interfaces
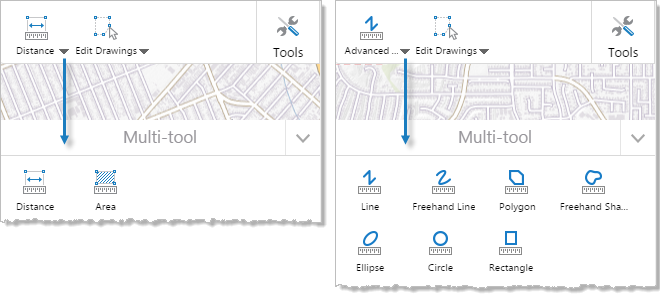
Measurement tools (left), and Advanced Measurement tools (right) in the Handheld interface
Measurement Tools
You can add measurement tools to a viewer's toolbar from the Toolbar page in Manager. There are two measurement tool groups that you can activate:
-
Measurement Tool Group
-
Measure: A multitool that adds measurement tools for distance and area.
-
MeasurementToolControlRegion: The context-sensitive toolbar for the Measure multitool. It adds a unit picker, snapping settings, and styling tools when the Measure tool is activated.
-
-
Advanced Measurement Tool Group
-
Measure: A multitool that adds measurement tools for distance and area, including various shape tools.
-
MeasurementToolControlRegion: The context-sensitive toolbar for the Measure multitool. It adds a unit picker, snapping settings, and styling tools when the Measure tool is activated.
-
Edit Measurement Drawings
The capability to include and provide editing of measurement drawings on a map tip is dependent on enabled set to true on the GraphicsLayerIdentifyProvider in the configuration of the Identify module. If enabled is set to false, the edit capability is not available.
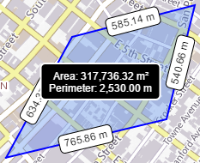
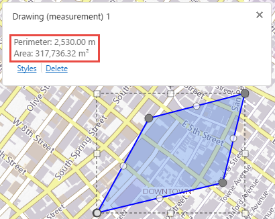
When a user adds a measurement drawing to the map and then clicks the drawing, it is automatically placed in edit mode. The edit handles for the drawing are visible, and the map tip opens. The map tip includes the dimensions for the associated drawing.
|
|
|
|
Area drawing on a map |
Area drawing in edit mode |
When the user changes the length or shape of the drawing on the map, the dimensions change in the map tip.
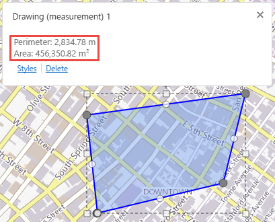
|
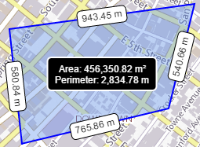
|
|
|
Dimensions changed in the map tip |
Dimensions shown on the drawing |
For information about editing the drawing on the map, changing its styles, and editing drawings that are overlaid, see Edit Drawings on the Map.
Note that drawings and measurement drawings are included in the results of an identify operation.
Measurement Editing Tools
To add measurement editing tools, you can add the Edit Drawings tool group:
-
Edit Drawings Tool Group
-
Edit Drawings: A multitool that allows you to edit existing map markup. It includes Edit, Erase, and Clear tools.
-
EditControlRegion: The context-sensitive toolbar for the Edit Drawings multitool. It adds a unit picker, snapping settings, and styling tools when the Edit Drawings tool is activated.
-
Export Drawings: A tool for exporting map markup. For more information, see Export Drawings and Measurement Markup.
-
If the Edit tool is selected, the Erase and Clear tools can be activated. These tools apply to both drawings and measurements.

With the Edit tool activated, the Erase, and Clear tools become available
Note that using Erase on drawings that overlay each other results in erasing all of the drawings. To avoid this behavior, the user can click the graphic to open the map tip, select the drawing to be deleted from the drop down list, and click Delete.
Measurement and Markup
When the user performs a measurement, the segment, perimeter, or area measurements display as markup on the map. The Measurement Module and the Markup Module are integrated so that measurement markup can be edited and styled like other markup.
When the user edits the length or area of measurement markup, the measurements are recalculated and adjusted on the map and in the map tip.
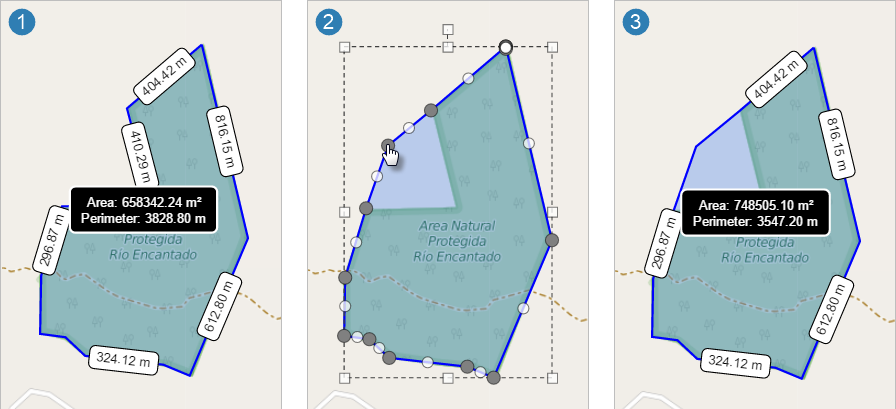
Measurements recalculated after the user changes the markup area
Measurement Data and the Results Table
You can configure viewers to show measurement data in the Results Table as well as on the map. See the setup procedure for instructions. The Results Table provides an easy-to-read presentation of measurement data. In addition:
-
The Results Table shows the angle and bearing, neither of which show on the map.
-
The Results Table has an export function that enables the user to export the data to a file.
The Results Table opens when the user completes the first measurement. Each measurement appears on a new tab. If the measurement shape is made up of straight lines, the table contains one line for each segment of the measurement.
When the user selects a row in the table, the map pans to the shape that the row represents. It highlights the shape on the map and opens a map tip containing the data from that row.
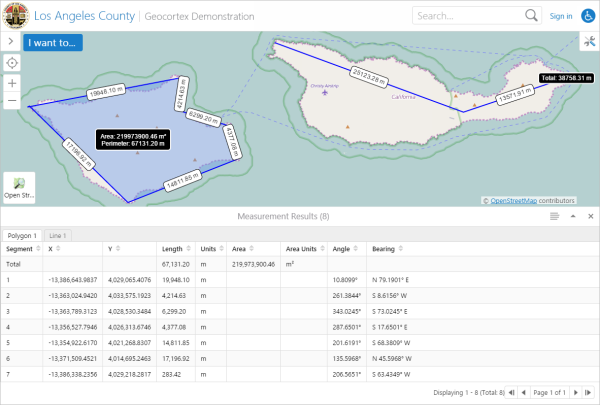
Measurement data in the Results Table
Measurement map tips and layer map tips get the header and main content from different sources. Measurement map tips get their content from the measurements, not from the layer configuration. Both types of map tip use the same footer configuration. For more information, see MapTips Module.
The user can export the measurement data to a file by selecting the Export Results option in the ![]() Panel Actions Menu, provided the Menu Module's
Panel Actions Menu, provided the Menu Module's ResultsTableActions has at least one export item configured. See Menu Module for more information.
To show measurement results in the Results Table:
-
In a text editor or XML editor, open one of the viewer configuration files—
Desktop.json.jsorTablet.json.js.By default, the configuration files are stored in the Sites folder:
Sites\[site]\Viewers\[viewer]\VirtualDirectory\Resources\Config\Default -
Find the
Measurementproperty in theResultsModule'sresultMappings.... { "moduleName": "Results", "moduleType": "geocortex.essentialsHtmlViewer.mapping.infrastructure.results.ResultsModule", "libraryId": "Mapping.Infrastructure", "configuration": { "resultMappings": { ... "Measurement": [], ... -
Set the
Measurementproperty toShowResultsTable."Measurement": ["ShowResultsTable"],
-
Save the file.
-
Repeat these steps for the other configuration file.
Measurement Projection
You can configure measurement projection settings from the Tool Behavior page in Manager or by setting the Measurement Module's configuration properties in the viewer configuration files. For more information about the Tool Behavior settings, see Tool Behavior.
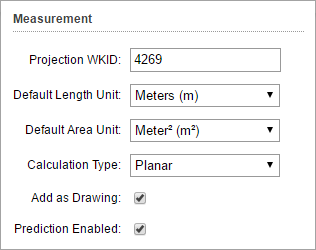
Measurement settings in the Tool Behavior section of the Management Pack
By default, projection is disabled. This setting only applies if the Calculation Type setting is set to Planar. If it is set to Geodesic or PreserveShape but measurementProjectionWkid is specified in the viewer configuration files, the viewer overrides the set calculation type and uses Planar.
If no measurement projection WKID is specified, the measurement calculation is done in the current spatial reference of the map. If no measurement projection WKID and no calculation type is specified, the viewer uses the geodesic calculation type, which does not require a WKID.
Configuration Properties
Module
-
tools: An array specifying the measurement tools (if any) that need to be registered with the tool registry. Measurement tools have the following properties:-
name: The name that identifies this tool.If your viewer is going to be available in more than one language, enter the text key that the tool name is assigned to. See Configure User Interface Text for more information on using text keys.
-
command: The command to be invoked by this tool. The command is eitherMeasureAreaorMeasureDistance. -
drawMode: The type of geometry that the user draws and the tool operates on. The possible modes include POLYGON forMeasureAreaor POLYLINE forMeasureDistance. -
isSticky: When set totrue, the tool remains selected after the user has used it. To deselect the tool, the user must click the tool a second time, or click a different tool. This allows the user to use a tool repeatedly without having to reselect it each time.If you do not want a tool to remain selected after it is used, set
isStickytofalse. -
iconUri: The image to display for this tool. -
statusText: The status message to display when the tool is activated, often containing instructions for the user. You can use a text key or the literal text.
If the tools are being registered from the TabbedToolbar Module, they do not need to be registered here.
-
-
measurementProjectionWkid: Defines the WKID of the projection for the Measurement Module to use. If not defined, projection is disabled. The default setting is to leave the field undefined. -
measurementLengthUnits: Defines the default unit of measurement to use for length. Possible values include feet, yard, meter, kilometer, mile, and nauticalMile. -
measurementAreaUnits: Defines the default unit of measurement to use for area. Possible values include sqFeet, sqYard, sqMeter, sqKilometer, sqMile, sqNauticalMile, acre, and hectare. -
coordinateFractionalDigits: The number of digits to show after the decimal point for coordinates and angles. The default is4.This precision setting cannot exceed the maximum representable IEEE 754 floating point. This is specified in the IEEE 754 standard. See double-precision floating-point format and significant figures for more information.
-
measurementFractionalDigits: The number of digits to process after the decimal point for measurements. The default is2.This precision setting cannot exceed the maximum representable IEEE 754 floating point. This is specified in the IEEE 754 standard. See double-precision floating-point format and significant figures for more information.
-
degreeFormat: The format for displaying angles and bearing. Possible values are dd (decimal degrees), ddm (degrees/decimal minutes), or dms (degrees/minutes/seconds). -
angleDirectionSystem: The direction system for angles. Possible values are polar, north_azimuth, or south_azimuth. For information about direction systems, refer to About direction measuring systems and units in the ArcGIS documentation. -
measurementResultTypes: A list of measurement shapes that generate measurement results. The HTML5 Viewer supports the shapes listed here. -
enablePrediction: Defines whether or not measurement units are predicted as you begin typing a unit. When set tofalse, it disables predictive measurements. The default value istrue. -
calculationType: Defines the calculation used by the Measurement Module. Only one of three values apply—preserveShape,geodesicorplanar.
Views
-
MeasurementView: (Desktop and Tablet interfaces only) Noconfigurationproperties -
MeasurementUnitSwitcherView: (Handheld interface only) Noconfigurationproperties
View Models
-
MeasurementViewModel:-
markupLayerName: The name of the layer on which drawings are placed. This layer does not appear in the layer list. The default name is Drawings.In order for the markup drawn by the Measurement Module to be editable by the Markup Module, the
markupLayerNamemust be the same for both modules. -
addMarkupToMapByDefault: Defines whether or not markup is added to the map by default. The default istrue. -
Text Size, Corner Rounding: The following properties control text size and corner rounding:
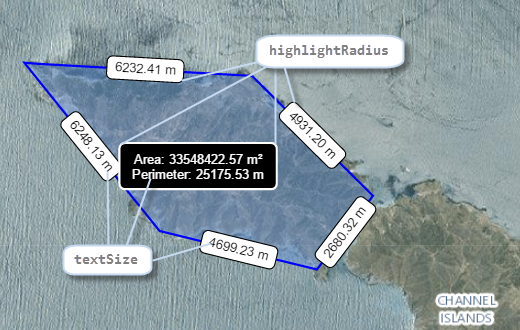
-
textSize: The size of the text markup for line segments and measurement totals, in pixels. You must specify the units. The default is 12px. -
highlightRadius: The radius to round the corners of the boxes that enclose line segment measurements and measurement totals, in pixels. When you specify the radius, omit the units. The default radius is 5.
-
-
Measurement Colors: The following properties control the colors of measurement lines and areas:
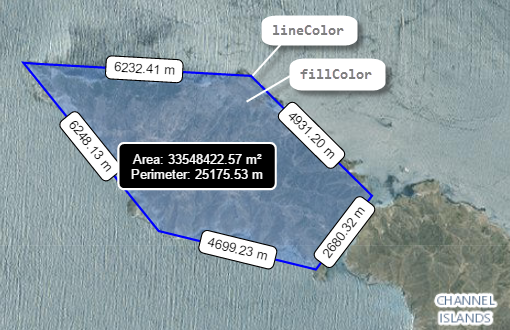
-
lineColor: The color of measurement lines on the map, including the lines for distance measurements and the outlines of area measurements. The color can be an HTML color name or a hexadecimal value, for example, red or #FF0000. The default color is #0000FF (blue). -
fillColor: The fill color inside area measurements. The color can be an HTML color name or a hexadecimal value, for example, green or #00FF00. The default color is #6495ED (cornflower blue).
-
-
Line Segment Measurements: The following properties control the appearance of the markup for the individual line segments in distance and area measurements:
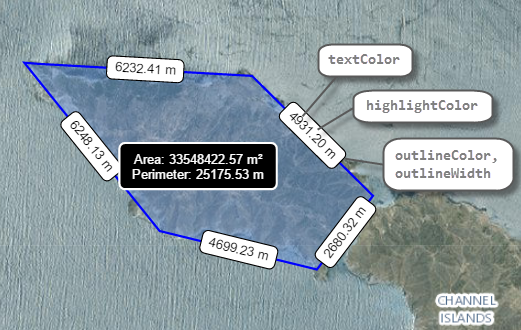
-
textColor: The color of the markup text for the individual line segments in a measurement. The color can be an HTML color name or a hexadecimal value, for example, blue or #0000FF. The default color is #000000 (black). -
highlightColor: The fill color for the boxes that enclose line segment measurements. The color can be an HTML color name or a hexadecimal value, for example, red or #FF0000. The default color is #FFFFFF (white). -
outlineColor: The border color for the boxes that enclose line segment measurements. The color can be an HTML color name or a hexadecimal value, for example, red or #FF0000. The default color is #000000 (black). -
outlineWidth: The border width for the boxes that enclose line segment measurements, in pixels. When you specify the width, omit the units. The default width is 1. -
lineDescriptionFormat: The text content for each line segment. You can include up to three different tokens, each representing different aspects of the line segment:-
{0}: The distance of the line. For example, a line that is 100 meters in length displays as 100.00 m.
-
{1}: The polar angle of the line. For example, a line heading directly east displays as 0.0000°. A line heading directly north displays as 90.0000°.
-
{2}: The quadrant bearing of the line. For example, a line heading 20 degrees east of north displays as N 20.0000° E.
By default, this property is omitted, which is identical to specifying a value of {0}.
-
-
-
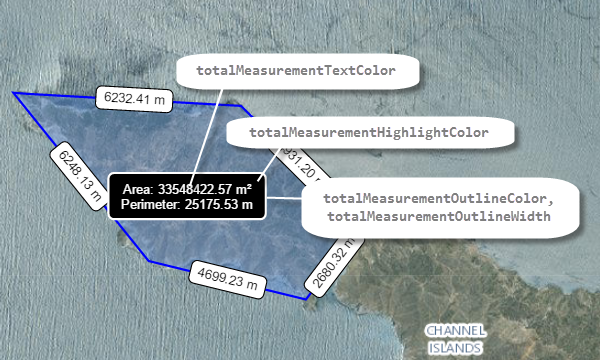
Total Measurement: The following properties control the appearance of the markup for measurement totals:
-
totalMeasurementTextColor: The color of the markup text for measurement totals. The color can be an HTML color name or a hexadecimal value, for example, red or #FF0000. The default color is #FFFFFF (white). -
totalMeasurementHighlightColor: The fill color for the box that encloses a measurement total. The color can be an HTML color name or a hexadecimal value, for example, red or #FF0000. The default color is #000000 (black). -
totalMeasurementOutlineColor: The border color for the box that encloses a measurement total. The color can be an HTML color name or a hexadecimal value, for example, red or #FF0000. The default color is #FFFFFF (white). -
totalMeasurementOutlineWidth: The border width for the box that encloses a measurement total, in pixels. When you specify the width, omit the units. The default width is 2.
-
-