Configure ArcGIS Layer Bands
Once you have configured map options for a view, you can add bands and charts to it. If you haven't yet added a band to VertiGIS Inline, see Add Bands.
The following sections describe how to configure bands in the VertiGIS Inline Designer:
Advanced configuration
Some of the configuration settings described below provide an Advanced option. Enabling this allows you to configure a function that sets the option at runtime, when the view is loaded in an application. Functions are not discussed in the following sections. For details, see Advanced Configuration.
General Band Options
These options set the basic properties of the band.
The ID field is not editable. This value is automatically assigned and used internally to identify the band - for example, it will display in any browser console error messages. You may use this field in advanced functions, if required (see Advanced Configuration).
-
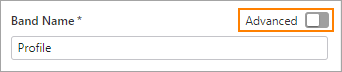
Band Name: Enter a name for the band. There are no character limits on the Band Name.
-
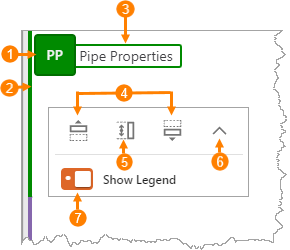
Band Name (Short): Enter a 1 - 3 character abbreviation for the band name. The abbreviation displays inside the band's icon in the upper-left corner of the band (shown below
 ). If you leave this text box empty, Inline creates the abbreviation for you.
 -
Accent Color: Set the color of the band's icon
, and the bar that displays along the left edge  . You can type the hex code or RGB values, or click the color picker to select a color.
 -
Default Chart Height: Select the preferred band height, or set a custom height by entering the number of pixels required.
Typically, the band height you choose will depend on the number of charts you intend to include inside the band, and the type of data these charts will display. You can change this setting later if you need to.
-
Hide Band Name on Start: Hides the band header when the view initially loads in the user's browser
 .
. -
Movable: Allows the user to move the band within the view by clicking Up and Down arrow buttons
 .
. -
Resizable: Allows the user to resize the band by clicking and dragging a slider
 .
. -
Collapsible: Allows the user to collapse / expand the band within the view
 .
. -
Include Legend: Allows you to include a legend for the charts in this band. You can toggle the legend visibility on and off in the band's menu
 .
.
If you select X-Small for the Default Chart Height, the header options described below are disabled.
Charts
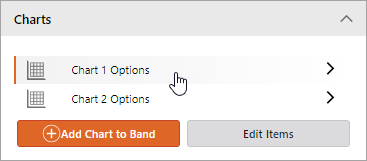
The Charts section lists all charts included in the band.
-
Click on a chart name to view and configure its options.
-
Click Edit Items to delete or copy a chart.
-
Click Add Chart to Band to add a new chart to the band.
See Work with Charts.
Tooltip Container Configuration
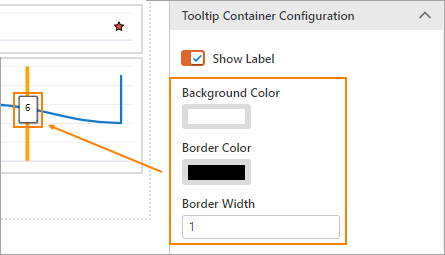
These options control the background and border of the tooltips that display on all charts in the band.
-
Show Label: By default tooltips are enabled. Turn them off by deselecting this option.
-
Background Color: Set the color of the tooltip background. Type the hex code or RGB values, or click the color picker and select a color.
-
Border Color: Set the color of the tooltip border. Type the hex code or RGB values, or click the color picker and select a color
-
Border Width: Set the width of the tooltip border.
Tooltip text and font options are configured at the chart level. See Working with Charts.
Y-Axis Options
These options control the values / labels displayed on the Y axis of the band.
Auto | Custom | Hide
-
By default, Auto is selected, and Y axis values are auto-generated based on the data source.
-
If you do not want to display values on the Y axis, select Hide.
-
To define custom values, select Custom and configure as follows:
-
Min and Max: Set the minimum and maximum Y axis values.
-
Ticks: Set the number of ticks to display on the Y axis.
-
Tick Values: Inline generates Y axis values / labels based on the Min and Max values and the number of ticks specified. These values are displayed in the leftmost column. (To reset values to the defaults, click Reset Step Values.) You can set custom Y axis values, in the rightmost column.
- To reset custom values to the default, auto-generated values, click Reset Step Values.
-
Actions
Actions are configured events that users can trigger from a band, chart or feature in an VertiGIS Inline view. For example, you might want to create an action that allows the user to print a report from a chart or search for data on the map.
See Work with Actions.