PlotCoordinates Module
The PlotCoordinates Module implements the ability for end users to show the coordinates for specific locations on the map. To show the coordinates for a particular location, the user can either select the location on the map or input coordinates using text boxes in the Plot Coordinates panel.
Plotted coordinates can be printed, saved as part of a project, or saved to an ArcGIS web map. For more information, see Printing Module, Project Module, and ExportWebMap Module. Plotted coordinates are removed from the map when the user ends the session.
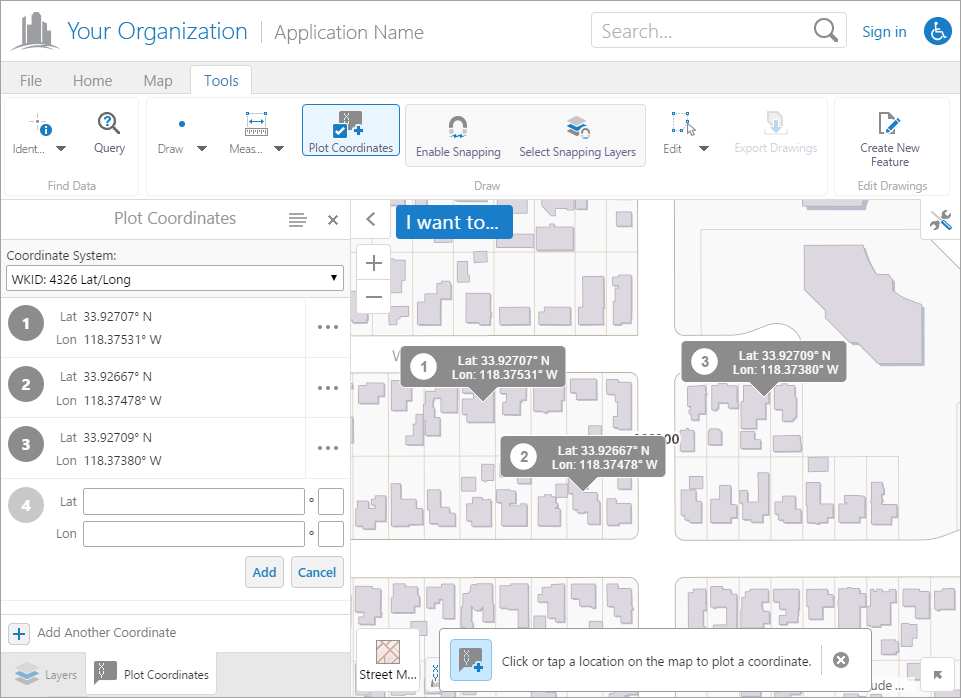
Coordinates plotted on the map, shown in the Desktop interface
Alternatively, the user can right-click the map and select the Plot a Coordinate option.
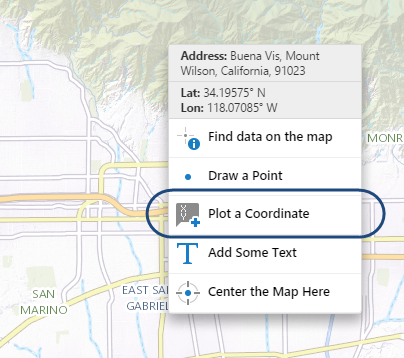
Right-click context menu with the Plot a Coordinate option
On a handheld device, the user must open the Plot Coordinates panel to input coordinates via the input text boxes.
In order for users to plot coordinates on the map, you must provide a way for them to open the Plot Coordinates panel. The HTML5 Viewer provides a Plot Coordinates tool that you can add to the toolbar.

Plot Coordinates tool
Alternatively, you can add an item to the I Want To menu or create a workflow that invokes the ActivatePlotCoordinatesView command to open the panel. I Want To Menu
Plotted coordinates exist only for the duration of the session—when the user closes the viewer, the coordinates disappear. To save plotted coordinates across sessions and share them with other users, a signed-in user can save a project, provided the viewer supports projects. For information about projects, see Project Module.
Change the Coordinate System
While the Plot Coordinates panel is open, the active coordinate system can be changed with the Coordinate System drop-down menu.
Show, Hide, Edit, or Remove Coordinates
The user can choose to show, hide, edit, or remove any saved plotted coordinate from a list of available actions by selecting the ![]() icon next to a coordinate in the Plot Coordinates panel.
icon next to a coordinate in the Plot Coordinates panel.
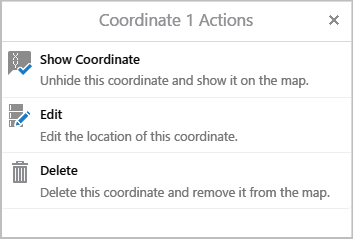
Plot Coordinates actions for a hidden coordinate
When the coordinates are shown, the panel would have a Hide Coordinate action instead of the Show Coordinate action.
Plotted coordinates can also be removed with the Edit Drawings multitool used to remove markup and measurements.
The icon and the callout map tips on the map indicate that they are being edited by turning blue. The user can select a new location on the map or edit the coordinates using the text boxes and selecting the Update button.
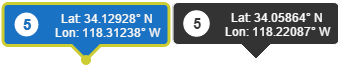
Plot Coordinates callout map tip being edited (left) and Plot Coordinates callout map tip (right)
Show, Hide or Delete All Coordinates
The user can show or hide all coordinates with the Show All Coordinates, Hide All Coordinates, and Delete All Coordinates actions available from the Plot Coordinates panel's Action Menu. This menu is accessed from the ![]() icon at the top of the panel.
icon at the top of the panel.
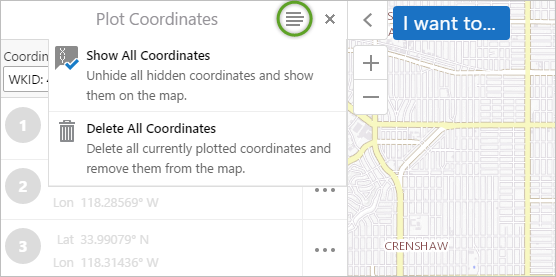
Show All Coordinates and Delete All Coordinates actions, displayed when the Coordinates Panel Action Menu button is toggled.
Display Plotted Coordinates in Results
The plotted coordinates can be configured to display in either the Results Table or the Results List by adding the command ShowResultsTable or ShowResultsList to the coordinates array in the Results Module configuration. This allows users to export coordinates.
Configuration Properties
Module
-
behaviors: An array of named behaviors that run when an associated event occurs. By default, the behaviors are:-
CoordinateListItemClickedBehavior: A behavior that runs an array of commands when a coordinate in the coordinates list is clicked. By default, this includes three commands:ClearDefaultHighlights,PanToFeature, andHighlightFeatureDefault. -
CoordinateEditingStartedBehavior: A behavior that runs an array of commands when a coordinate starts to be edited. By default, this includes two commands:ActivatePlottedCoordinatesViewandOpenDataFrame. -
CancelEdtCoordinateBehavior: A behavior that runs an array of commands when a user discards an edit to a coordinate. By default, this includes one command:ClearActiveTool. -
CoordinateEditedBehavior: A behavior that runs an array of commands while a coordinate is being edited. By default, this includes three commands:ClearDefaultHighlights,ActivatePlotCoordinatesView, andOpenDataFrame. -
CoordinateDeletedBehavior: A behavior that runs an array of commands when a coordinate is deleted. By default, it includes one command:ClearDefaultHighlights. -
CoordinateAddedBehavior: A behavior that runs an array of commands when a coordinate is added. By default, it includes three commands:ClearDefaultHighlights,ActivatePlotCoordinatesView, andOpenDataFrame.
-
-
tools:-
name: The name of the tool.If your viewer is going to be available in more than one language, enter the text key that the tool name is assigned to. See Configure User Interface Text for more information on using text keys.
-
command: The command that the tool runs.For a list of commands, see Viewer Commands and Events.
-
drawMode: The type of geometry the user draws, upon which the tool operates. -
hideOnDisable: If this property is set to true and the button's command cannot run under the current configuration or run-time conditions, the button does not show in the toolbar. -
isSticky: When set totrue, the tool remains selected after the user has used it. To deselect the tool, the user must click the tool a second time, or click a different tool. This allows the user to use a tool repeatedly without having to reselect it each time.If you do not want a tool to remain selected after it is used, set
isStickytofalse. -
iconUri: The image that displays beside the tool. -
statusText: The status message to display when the tool's input method is via mouse, often containing instructions for the user. You can use a text key or the literal text. -
keyboardStatusText: The status message to display when the tool's input method is via keyboard, often containing keyboard shortcut hints for the user. You can use a text key or the literal text.
-
Views
-
PlotCoordinatesView: Noconfigurationproperties -
CoordinateActionsView:-
menuId: The ID of the menu displayed in the view. The default isCoordinateActions.
-
View Models
-
PlotCoordinatesViewModel:-
isEnabled: A boolean that sets whether the view model is enabled. The default value istrue. -
coordinatesModel: Sets the coordinates view model. The default value isMapCoordinatesModel, which is a view model configured as part of the Map Module.
-
-
CoordinateActionsViewModel: Noconfigurationproperties